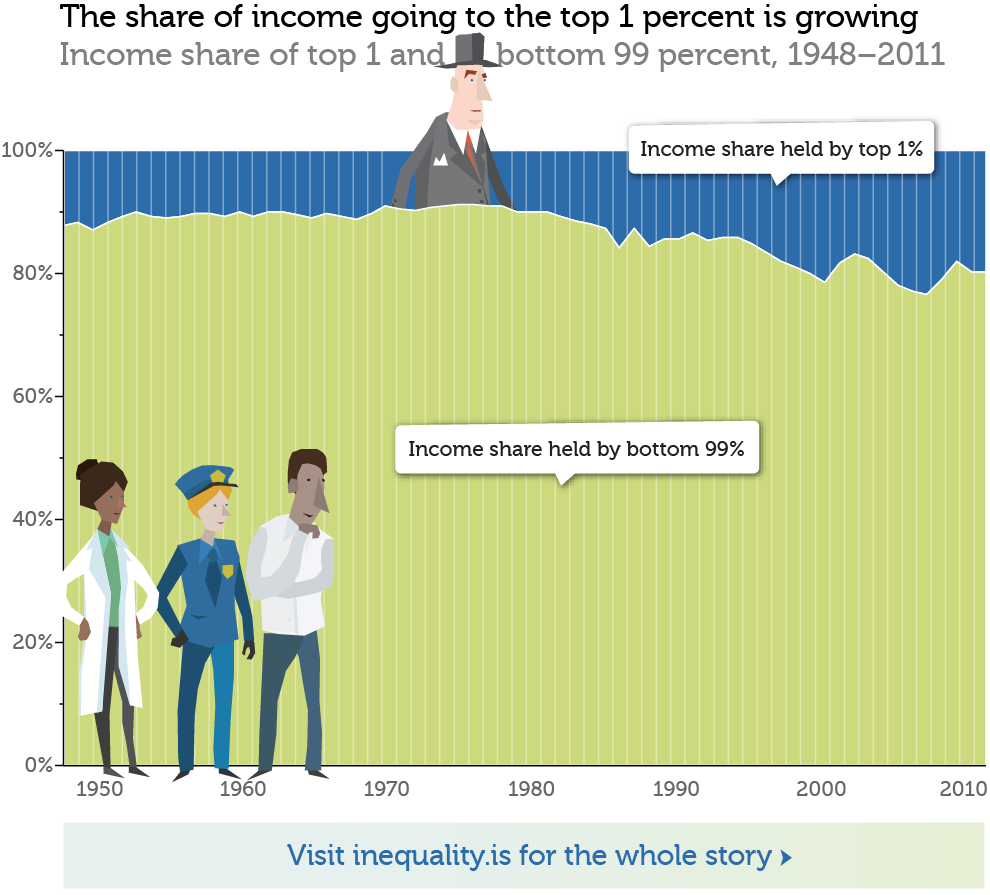
Economic inequality is one of the most serious challenges we face, and it’s getting worse. As CEOs, executives, financial professionals and others take home more and more, ordinary Americans are taking home less. Today, the top one percent of earners are taking home 20 percent of America’s income.
The graphic below is based on inequality.is, EPI’s new website devoted to explaining economic inequality and what it means to ordinary Americans. It shows the shares of income for the top one percent and the bottom 99 percent of income earners in the United States. Income growth between 1948 and 1979 was strong and broadly shared, as shown by the relatively stable shares of income going to the top and bottom, respectively. The inequality found in 1948 generally persisted over the 30 year period, but did not worsen.
But between 1979 and 2011, income growth slowed and favored those at the top. Since 1979, the total share of income claimed by the bottom 99 percent has steadily decreased. By 2011, the top one percent had captured an additional 10 percent of the nation’s income.
This was the result of intentional policy decisions on taxes, trade, labor, macroeconomics, and financial regulation.

