Full Report
This report provides an update to a series that has tracked public school teacher wages and compensation over the last two decades.1 Because public school teachers must attain at least a bachelor’s degree to teach in the U.S., this research compares the pay of public school teachers with that of college graduates who work in other professions. Documenting the widening divergence between the wages of teachers and their college-educated counterparts over time allows for a historical analysis of an issue that is critical to the future of the United States. Providing teachers with compensation commensurate with that of similarly educated and experienced professionals is necessary to retain and attract qualified workers into the teaching profession.
Data and relevant information
In analyzing differences in pay between public school teachers and other college graduates, I use two sources of data, both from the Bureau of Labor Statistics (BLS).2 First, I use Current Population Survey Outgoing Rotation Groups (CPS-ORG) data for the weekly wage analyses (BLS 2024a). I focus on weekly wages, as opposed to weekly hours worked or the length of the work year, to account for the “summers off” issue that affects teachers but not other college graduates.3 The sample is restricted to full-time workers (working at least 35 hours per week) aged between 18 and 64, with at least a bachelor’s degree, because teachers today need at least a bachelor’s degree to teach. The sample is further limited to those who reported their wage information directly (those who didn’t respond and whose wages were estimated by BLS are excluded).4 To preserve data confidentiality, the BLS records weekly wages only up to a defined threshold, so the wage amounts above this threshold aren’t specifically identifiable in the data. This is called top-coding. The threshold, however, is rarely undated. As a result, a growing share of workers are assigned top-coded wages that are below their actual wages, which has generated a growing understatement of college graduate wages relative to those of teachers. EPI replaces original top-coded values with Pareto-distribution implied means above the CPS top-code for men and women.5
I use a second data source to assess benefits: the BLS National Compensation Survey’s Employer Costs for Employee Compensation series (ECEC 2024a). Specifically, I pull data on employer costs per hour worked for detailed categories of compensation for “primary, secondary, and special education school teachers” in the public sector, and the same data for “civilian professionals,” which is the broadest category available that largely corresponds to college graduates. “Benefits,” in my analysis, refer to employer costs for health and life insurance, retirement plans, and payroll taxes (covering Social Security, unemployment insurance, and workers’ compensation).
The remaining components of compensation are “W-2 wages,” a measure that corresponds to the wages captured in the CPS data used above. W-2 wages are the wages reported to employees and to the Internal Revenue Service. They include “direct wages”—defined by the BLS as “regular payments from the employer to the employee as compensation for straight-time hourly work, or for any salaried work performed”—and other wage items, including “supplemental pay.” Supplemental pay includes premium pay for overtime, bonus pay, profit-sharing, and paid leave.
Findings
I present the results of my research in four sections. I first show the trends in the simple (not regression-adjusted) average weekly wages for public school teachers and other college graduates from 1979 through 2022 (adjusted for inflation). Second, I report annual estimates of the national teacher weekly wage gap using standard regression techniques to control for systematic differences in age, education, state of residence, and other factors known to affect wage rates. Third, I present regression-adjusted estimates of the teacher wage gap for each state and the District of Columbia. Lastly, nonwage benefits are factored in to estimate a total compensation penalty that accounts for the estimated teacher wage penalty, along with the teacher “benefits advantage,” to estimate a total compensation differential at the national level (which is not possible to calculate for each state).
Simple level differences: weekly wage trends
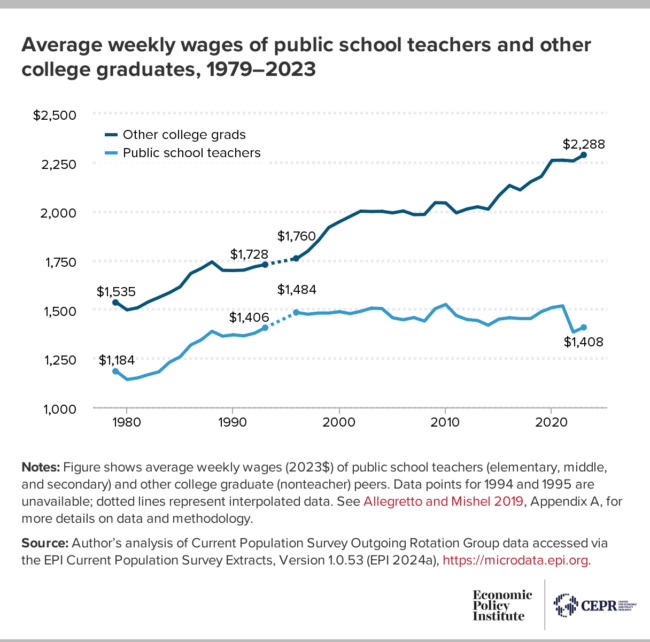
I start by showing the level of average weekly wages of public school teachers and other college graduates in Figure A. These data are national annual averages adjusted only for inflation (i.e., not regression-adjusted). For there to be real improvements in living standards for teachers, nominal increases in pay would need to exceed the rate of inflation—in other words, the inflation-adjusted trends in Figure A would have to be increasing.
Average weekly wages of public school teachers and other college graduates, 1979–2023
| Year | Public school teachers | Other college grads | Public school teachers | Other college grads | Public school teachers | Other college grads |
|---|---|---|---|---|---|---|
| 1979 | $1,184
|
$1,535
|
||||
| 1980 | $1,142 | $1,497 | ||||
| 1981 | $1,150 | $1,508 | ||||
| 1982 | $1,167 | $1,538 | ||||
| 1983 | $1,181 | $1,561 | ||||
| 1984 | $1,230 | $1,585 | ||||
| 1985 | $1,258 | $1,615 | ||||
| 1986 | $1,318 | $1,683 | ||||
| 1987 | $1,345 | $1,709 | ||||
| 1988 | $1,388 | $1,742 | ||||
| 1989 | $1,363 | $1,699 | ||||
| 1990 | $1,370 | $1,698 | ||||
| 1991 | $1,365 | $1,700 | ||||
| 1992 | $1,378 | $1,717 | ||||
| 1993 | $1,406
|
$1,728
|
$1,406 | $1,728 | ||
| 1994 | $1,432 | $1,739 | ||||
| 1995 | $1,458 | $1,749 | ||||
| 1996 | $1,484 | $1,760 | $1,484
|
$1,760
|
||
| 1997 | $1,475 | $1,796 | ||||
| 1998 | $1,481 | $1,850 | ||||
| 1999 | $1,481 | $1,918 | ||||
| 2000 | $1,488 | $1,947 | ||||
| 2001 | $1,478 | $1,974 | ||||
| 2002 | $1,490 | $2,001 | ||||
| 2003 | $1,506 | $1,999 | ||||
| 2004 | $1,504 | $2,000 | ||||
| 2005 | $1,457 | $1,992 | ||||
| 2006 | $1,447 | $2,002 | ||||
| 2007 | $1,458 | $1,983 | ||||
| 2008 | $1,440 | $1,984 | ||||
| 2009 | $1,503 | $2,044 | ||||
| 2010 | $1,525 | $2,043 | ||||
| 2011 | $1,468 | $1,992 | ||||
| 2012 | $1,448 | $2,012 | ||||
| 2013 | $1,443 | $2,023 | ||||
| 2014 | $1,419 | $2,011 | ||||
| 2015 | $1,450 | $2,080 | ||||
| 2016 | $1,457 | $2,132 | ||||
| 2017 | $1,453 | $2,109 | ||||
| 2018 | $1,453 | $2,151 | ||||
| 2019 | $1,488 | $2,178 | ||||
| 2020 | $1,509 | $2,260 | ||||
| 2021 | $1,518 | $2,261 | ||||
| 2022 | $1,384 | $2,257 | ||||
| 2023 | $1,408
|
$2,288
|
Notes: Figure shows average weekly wages (2023$) of public school teachers (elementary, middle, and secondary) and other college graduate (nonteacher) peers. Data points for 1994 and 1995 are unavailable; dotted lines represent interpolated data. See Allegretto and Mishel 2019, Appendix A, for more details on data and methodology.
Source: Author’s analysis of Current Population Survey Outgoing Rotation Group data accessed via the EPI Current Population Survey Extracts, Version 1.0.53 (EPI 2024a), https://microdata.epi.org.
As shown in Figure A, inflation-adjusted teacher wages were relatively flat from 1996 through 2021, indicating that teacher wages, on average, were just keeping up with the rate of inflation. This was also the case for the wages of other college graduates but for a shorter time span (2002–2014), after which real increases ensued.
Figure A shows that there was a small increase in teachers weekly wages of 1.7% ($24.00) in 2023, but it was nowhere near enough to undo the 8.8% decline that occurred in 2022—leaving the series near its post-1996 low point. From 1996 through 2023, teacher wages fell by 5.1%, mostly due to the steep decline in teacher weekly wages in 2022. Conversely, the wages of other college graduates increased 30.0% over that timeframe; their wages increased significantly from 2014 onwards and experienced a slight decline in 2022.
Addressing the long-term stagnation of teacher wages requires that future increases in pay exceed future rates of inflation to recover the big loss in wages that occurred in 2022. Local and state politicians, community leaders, and the public can help by highlighting the severity of the issue in their communities. Meaningfully boosting teacher pay requires a concerted effort by local and state governments—with support from the federal government—to pass the right policies.
Relative differences: regression-adjusted trends
The weekly wages discussed above are simple averages (not regression-adjusted) for teachers and other college graduates. However, the two groups may differ fundamentally in ways that typically affect pay on margins—such as age, educational attainment, race/ethnicity, and state of residence. For instance, all else being equal, one would expect experienced workers to earn more than younger workers who are just starting out in their careers. Controlling for age within a regression model therefore accounts for such differences across the two samples. Thus, I use standard regression techniques to estimate weekly wages of public school teachers relative to other similarly situated college graduates working in other professions, which can provide a more apples-to-apples comparison of earnings.6 I report regression-adjusted estimates for all teachers (which includes a gender control), as well as separately for women and men.
Results presented in Figure B show how much less (or more) teachers earn in weekly wages relative to other college graduates, estimated via regression analysis. A weekly wage “penalty” for teachers is reported when the regression estimates suggest that teachers, all else equal, are paid less than other college graduates. A penalty appears as a negative number in Figure B. When teachers are paid relatively more, the number is positive and is referred to as a “premium.”
Teachers earn 26.6% less than comparable college graduates: Public school teacher weekly wage penalty (or premium) for all teachers and by gender, 1979–2023
| Year | All | Female | Male | All | Female | Male | All | Female | Male |
|---|---|---|---|---|---|---|---|---|---|
| 1979 | -7.1%
|
6.5%
|
-16.6%
|
||||||
| 1980 | -9.31% | 4.48% | -19.17% | ||||||
| 1981 | -10.06% | 3.12% | -18.97% | ||||||
| 1982 | -10.21% | 2.84% | -19.36% | ||||||
| 1983 | -11.82% | 1.04% | -20.72% | ||||||
| 1984 | -10.04% | 2.48% | -19.68% | ||||||
| 1985 | -10.22% | 1.87% | -19.54% | ||||||
| 1986 | -8.79% | 3.18% | -18.36% | ||||||
| 1987 | -7.89% | 3.85% | -18.08% | ||||||
| 1988 | -8.01% | 5.12% | -18.17% | ||||||
| 1989 | -8.21% | 3.04% | -17.00% | ||||||
| 1990 | -7.73% | 4.03% | -17.87% | ||||||
| 1991 | -9.07% | 0.63% | -16.33% | ||||||
| 1992 | -7.01% | 3.08% | -15.57% | ||||||
| 1993 | -5.1%
|
4.1% | -13.1%
|
-5.10% | 4.10% | -13.10% | |||
| 1994 | -5.40% | 2.70% | -13.70% | ||||||
| 1995 | -5.70% | 1.30% | -14.40% | ||||||
| 1996 | -6.1% | -0.1% | -15.1% | -6.1% | -0.1% | -15.1% | |||
| 1997 | -6.20% | 1.20% | -18.60% | ||||||
| 1998 | -9.00% | -1.50% | -20.50% | ||||||
| 1999 | -10.40% | -2.70% | -21.70% | ||||||
| 2000 | -11.80% | -5.10% | -22.70% | ||||||
| 2001 | -12.10% | -4.00% | -25.30% | ||||||
| 2002 | -12.10% | -5.10% | -24.10% | ||||||
| 2003 | -11.30% | -4.90% | -21.20% | ||||||
| 2004 | -12.80% | -6.20% | -23.30% | ||||||
| 2005 | -13.30% | -6.30% | -24.50% | ||||||
| 2006 | -15.00% | -8.00% | -27.30% | ||||||
| 2007 | -11.70% | -4.70% | -23.40% | ||||||
| 2008 | -14.50% | -7.70% | -25.70% | ||||||
| 2009 | -12.50% | -4.50% | -24.70% | ||||||
| 2010 | -11.90% | -4.60% | -23.70% | ||||||
| 2011 | -12.80% | -6.40% | -24.20% | ||||||
| 2012 | -16.00% | -10.00% | -26.20% | ||||||
| 2013 | -16.40% | -10.10% | -27.30% | ||||||
| 2014 | -16.50% | -10.50% | -26.20% | ||||||
| 2015 | -18.40% | -13.40% | -26.70% | ||||||
| 2016 | -19.40% | -12.20% | -31.60% | ||||||
| 2017 | -20.90% | -15.50% | -30.50% | ||||||
| 2018 | -22.00% | -15.90% | -31.80% | ||||||
| 2019 | -19.20% | -13.20% | -30.20% | ||||||
| 2020 | -21.60% | -15.20% | -33.80% | ||||||
| 2021 | -23.5% | -17.1% | -35.2% | ||||||
| 2022 | -26.4% | -21.3% | -36.6% | ||||||
| 2023 | -26.6%
|
-21.4%
|
-36.3%
|
Notes: Figure shows regression-adjusted weekly wage penalties (or premiums) for public school teachers (elementary, middle, and secondary) relative to their college-educated, nonteaching peers. Data points for 1994 and 1995 are unavailable; dotted lines represent interpolated data. See Allegretto and Mishel 2019, Appendix A, for more details on data and methodology.
Figure reports regression-adjusted teacher weekly wage penalties: how much less, in percentage terms, public school teachers (elementary, middle, and secondary) earn in weekly wages relative to their college-educated, nonteaching peers. College-educated workers refers to workers who have a bachelor’s degree or more education. The dependent variable is (log) weekly wages with indicator controls on public school teacher, private school teacher, gender, and married, along with indicator sets on education (M.A., professional degree, Ph.D.) and race/ethnicity (Black, Hispanic, other); also included are age as a quartic and state fixed effects. See Allegretto and Mishel 2019, Appendix A, for more details on data and methodology.
Source: Author’s analysis of Current Population Survey Outgoing Rotation Group data accessed via the EPI Current Population Survey Extracts, Version 1.0.53 (EPI 2024a), https://microdata.epi.org.
Starting in 1979 and throughout this series, relative weekly wages for all teachers have lagged behind those of other similarly qualified professionals (middle line Figure B). Pre-1994, the teacher wage gap averaged 8.7%, but the shortfall worsened considerably starting in the mid-1990s. The teaching penalty hit a record of 26.6% in 2023, which was slightly worse than the penalty recorded in 2022 (26.4%). Otherwise, on average, teachers earned 73.4 cents on the dollar in 2023, compared with what similar college graduates earned working in other professions—much less than the relative 93.9 cents on the dollar that teachers earned in 1996.
As shown in Figure B, the relative female teacher wage, compared with other female professionals, was at a premium that averaged 3.3% in the pre-1994 period. But starting in 1996, the female wage gap quickly went from parity to a penalty, landing at a 21.4% penalty in 2023, slightly worse than the 21.3% gap estimated in 2022.
My previous research (using decennial Census data) confirmed that, over a longer timeframe, the relative wage estimates for female teachers moved from significant premiums to large penalties. For example, I documented that relative female teacher earnings were at a 14.7% premium in 1960, which lessened to 10.4% in 1970 and to near parity in 1980 (pre-1979 years not shown in Figure B). Using the estimates from 2023, the cumulative change has been a 36.1 percentage-point deterioration in the relative wage of female teachers since 1960.7
There is an important story behind the declining relative wages of female teachers. Historically, the teaching profession relied on a somewhat captive labor pool of educated women who had few employment opportunities. This is thankfully no longer the case, but increased opportunity costs are a part of the story and reflected in much of this research. Expanding opportunities enabled women to earn more as they entered occupations and professions from which they were once barred. Today, a much smaller share of educated women chooses the teaching profession over expanding opportunities with better pay. Simply maintaining the quality of the current labor market pool for teachers will require significant raises in real teachers’ pay to compete with other professions for female workers. Otherwise, the quality of education will be compromised.
The relative wages of male teachers have seen sizable penalties throughout the timeframe of this paper (1979–2023) and my analyses using 1960, 1970, and 1980 decennial Census data. Over the long run, the male penalty worsened from 20.5% in 1960 (not shown in Figure B) to 36.3% in 2023. The very large male teaching penalty that persists today goes a long way in explaining why men who may want to teach may be compelled to choose other career paths, which are on average much more lucrative. The large male teacher penalty partly explains why approximately three in four teachers are women—a ratio that has not changed much since 1960.
Relative teacher weekly wage penalties by state
I have reported that the overall teacher weekly wage penalty was 26.6% in 2023. But there is much variation across states. To produce regression estimates by state, I pool six years (2018–2023) of CPS data to assure ample sample sizes for each state. Again, I compare public school teachers with nonteacher college graduates within each state and estimate regression-adjusted weekly wage gaps for each state and the District of Columbia.
Teacher weekly wage penalty exceeds 20% in 36 states: Regression-adjusted estimates by state, pooled CPS data for 2018–2023
| State | Teacher weekly pay penalty |
|---|---|
| Colorado | -38.4% |
| Arizona | -32.9% |
| Virginia | -32.0% |
| Oklahoma | -31.8% |
| New Hampshire | -31.6% |
| Minnesota | -31.0% |
| Alabama | -31.0% |
| Oregon | -29.4% |
| Georgia | -29.3% |
| Missouri | -28.6% |
| Washington | -28.0% |
| Utah | -27.8% |
| Maryland | -27.8% |
| Tennessee | -27.6% |
| Idaho | -27.1% |
| Louisiana | -27.0% |
| Kansas | -25.3% |
| North Carolina | -25.0% |
| Kentucky | -25.0% |
| Arkansas | -24.5% |
| Wisconsin | -24.3% |
| Texas | -24.0% |
| Nebraska | -23.8% |
| Illinois | -23.6% |
| North Dakota | -22.9% |
| Indiana | -22.8% |
| Michigan | -22.6% |
| Florida | -21.9% |
| Connecticut | -21.7% |
| Maine | -21.0% |
| Montana | -20.8% |
| District of Columbia | -20.7% |
| New Mexico | -20.6% |
| West Virginia | -20.5% |
| California | -20.4% |
| Nevada | -20.1% |
| Massachusetts | -19.9% |
| Iowa | -18.6% |
| Pennsylvania | -18.1% |
| Hawaii | -17.8% |
| South Dakota | -17.5% |
| Alaska | -17.5% |
| Ohio | -16.0% |
| New York | -15.6% |
| Vermont | -14.4% |
| Mississippi | -14.0% |
| Delaware | -12.3% |
| New Jersey | -11.5% |
| South Carolina | -10.5% |
| Rhode Island | -9.7% |
| Wyoming | -9.0% |
Notes: Figure shows state-specific regression-adjusted weekly wage penalties for public school teachers (elementary, middle, and secondary) relative to their college-educated, nonteaching peers. See Allegretto and Mishel 2019, Appendix A, for more details on data and methodology.
Figure reports state-specific regression-adjusted teacher weekly wage penalties: how much less, in percentage terms, public school teachers (elementary, middle, and secondary) earn in weekly wages relative to their college-educated, nonteaching peers. College-educated workers refers to workers who have a bachelor’s degree or more education. The dependent variable is (log) weekly wages with indicator controls on public school teacher, public school teacher interacted with each state (relevant estimate), private school teacher, gender, and married, along with indicator sets on education (M.A., professional degree, Ph.D.) and race/ethnicity (Black, Hispanic, other); also included are age as a quartic, state fixed effects. See Allegretto and Mishel 2019, Appendix A, for more details on data and methodology.
Source: Author’s analysis of pooled 2018-2023 Current Population Survey Outgoing Rotation Group data accessed via the EPI Current Population Survey Extracts, Version Version 1.0.53 (EPI 2024a), https://microdata.epi.org.
As in previous reports, Figure C shows that in no state does the relative (regression-adjusted) weekly wage for teachers equal or surpass that of their nonteaching college graduate counterparts. The bars are sorted from the largest (38.4%) to the smallest (9.0%) penalties across the US.
There are seven states where teachers, on average, earn less than 70 cents on the dollar compared with similar college graduates in their respective states. The states with the largest penalties are Colorado (38.4%), Arizona (32.9%), Virginia (32.0%), Oklahoma (31.8%), New Hampshire (31.6%), Minnesota (31.0%), and Alabama (31.0%). Unsurprisingly, the first four states listed had huge walkouts in response to low pay and public education funding in 2018–2019.8
Figure D is a map presentation of the state penalties reported in Figure C.
How big is the teaching penalty in your state?: Teachers make between 9.0% and 38.4% less than other comparable college-educated workers across the country
This interactive feature is not supported in this browser.
Please use a modern browser such as Chrome or Firefox to view the map.
| State | Penalty |
|---|---|
| Alabama | -31.0% |
| Alaska | -17.5% |
| Arizona | -32.9% |
| Arkansas | -24.5% |
| California | -20.4% |
| Colorado | -38.4% |
| Connecticut | -21.7% |
| Delaware | -12.3% |
| District of Columbia | -20.7% |
| Florida | -21.9% |
| Georgia | -29.3% |
| Hawaii | -17.8% |
| Idaho | -27.1% |
| Illinois | -23.6% |
| Indiana | -22.8% |
| Iowa | -18.6% |
| Kansas | -25.3% |
| Kentucky | -25.0% |
| Louisiana | -27.0% |
| Maine | -21.0% |
| Maryland | -27.8% |
| Massachusetts | -19.9% |
| Michigan | -22.6% |
| Minnesota | -31.0% |
| Mississippi | -14.0% |
| Missouri | -28.6% |
| Montana | -20.8% |
| Nebraska | -23.8% |
| Nevada | -20.1% |
| New Hampshire | -31.6% |
| New Jersey | -11.5% |
| New Mexico | -20.6% |
| New York | -15.6% |
| North Carolina | -25.0% |
| North Dakota | -22.9% |
| Ohio | -16.0% |
| Oklahoma | -31.8% |
| Oregon | -29.4% |
| Pennsylvania | -18.1% |
| Rhode Island | -9.7% |
| South Carolina | -10.5% |
| South Dakota | -17.5% |
| Tennessee | -27.6% |
| Texas | -24.0% |
| Utah | -27.8% |
| Vermont | -14.4% |
| Virginia | -32.0% |
| Washington | -28.0% |
| West Virginia | 20.5% |
| Wisconsin | -24.3% |
| Wyoming | -9.0% |
Notes: Figure shows state-specific regression-adjusted weekly wage penalties for public school teachers (elementary, middle, and secondary) relative to their college-educated, nonteaching peers. See Allegretto and Mishel 2019, Appendix A, for more details on data and methodology.
Figure reports state-specific regression-adjusted teacher weekly wage penalties: how much less, in percentage terms, public school teachers (elementary, middle, and secondary) earn in weekly wages relative to their college-educated, nonteaching peers. College-educated workers refers to workers who have a bachelor’s degree or more education. The dependent variable is (log) weekly wages with indicator controls on public school teacher, public school teacher interacted with each state (relevant estimate), private school teacher, gender, and married, along with indicator sets on education (M.A., professional degree, Ph.D.) and race/ethnicity (Black, Hispanic, other); also included are age as a quartic, state fixed effects. See Allegretto and Mishel 2019, Appendix A, for more details on data and methodology.
Source: Author's analysis of pooled 2018-2023 Current Population Survey Outgoing Rotation Group data accessed via the EPI Current Population Extracts, Version 1.0.53 (EPI 2024a), https://microdata.epi.org/
Adding benefits to the analysis
The weekly wages analyzed to this point make up a significant part of compensation, but to capture the total compensation of teachers and nonteaching professionals, I add in other benefits of employment, such as health and other insurance, and retirement plans. Teachers generally receive a higher share of their compensation as benefits compared with other professionals, partially offsetting the weekly wage penalty. In this section, I examine teachers’ “benefits advantage” and how it impacts relative total compensation.
The BLS Employer Costs for Employee Compensation (ECEC) series measures the average employer cost per employee hour worked for total compensation, wages and salaries, benefits, and costs as a share of total compensation. I compare benefits packages of primary, secondary, and special education public school teachers with those of comparable workers (specifically, workers in professional occupations).9 Table 1 shows a summary of my calculations.
The teacher compensation penalty was 16.7% in 2023: Trends in the teacher total compensation penalty, selected years, 1979–2023
| W-2 wage share of compensation | Public school teachers | ||||
|---|---|---|---|---|---|
| Year | Professionals | Public school teachers | Wage penalty | Benefits advantage | Compensation penalty |
| 1979 | n.a. | n.a. | -7.3% | n.a. | n.a. |
| 1993 | n.a. | n.a. | -5.1% | 2.4% | -2.7% |
| 2004 | 81.3% | 79.3% | -12.8% | 2.2% | -10.7% |
| 2007 | 80.7% | 77.2% | -11.7% | 4.0% | -7.7% |
| 2010 | 79.8% | 75.6% | -11.9% | 4.9% | -7.1% |
| 2017 | 78.1% | 71.4% | -20.9% | 7.4% | -13.5% |
| 2018 | 78.5% | 70.9% | -22.0% | 8.3% | -13.7% |
| 2019 | 78.6% | 70.7% | -19.2% | 9.0% | -10.2% |
| 2020 | 78.4% | 70.5% | -21.6% | 8.8% | -12.8% |
| 2021 | 78.5% | 70.1% | -23.5% | 9.3% | -14.2% |
| 2022 | 78.7% | 69.8% | -26.4% | 9.4% | -17.0% |
| 2023 | 79.0% | 69.6% | -26.6% | 9.9% | -16.7% |
| Percentage-point change | |||||
| 1993-2007 | n.a. | n.a. | -6.6 | 1.6 | -5.0 |
| 1994-2007 | -0.6 | -2.1 | n.a. | n.a. | n.a. |
| 2004-2019 | -2.7 | -8.6 | -6.4 | 6.8 | 0.4 |
| 2019-2023 | 0.5 | -1.1 | -7.4 | 1.0 | -6.5 |
| 2004-2023 | -2.3 | -9.7 | -13.8 | 7.8 | -6.0 |
Notes: The benefits advantage is the degree to which higher benefits offset the wage penalty. See the “Computing the Benefits Advantage” section in Appendix A of Allegretto and Mishel 2019 for data and methodology details. “n.a.” indicates that data are not available. Explanations of missing data and other data issues are documented in the “Historical Data Issues” section of the 2019 appendix.
Source: Author’s analysis of Current Population Survey Outgoing Rotation Group data and Bureau of Labor Statistics Employer Costs for Employee Compensation Data.
The first two columns in Table 1 under “W-2 wage share of compensation” report the share of W-2 wages that make up total compensation for professionals in all occupations and for state and local K–12 public school teachers. The shares of compensation for W-2 wages and benefits add up to 100. The W-2 shares allow for an examination of how important wages are relative to benefits in the total compensation package.
In 2023, W-2 wages made up 69.6% of teachers’ total compensation, whereas the share was 79.0% for nonteaching professionals. That means that for every dollar of teachers’ total compensation, 69.6 cents went to wages and 30.4 cents went to benefits. For professionals, 79.0 cents went to wages and 21.0 cents went to benefits. Therefore, for every dollar of total compensation, public school teachers receive more in benefits than other professionals. I refer to this as the “benefits advantage.”10
The columns under “public school teachers” in Table 1 provide the information needed to assess total compensation on average for the United States. The “wage penalty” column reports the teacher wage penalty estimates from Figure B, followed by the benefits advantage calculation for teachers. Combining the two gives us a measure of how teachers compare to other professionals on total compensation, which is reported in the last column. Per usual, the benefits advantage for teachers partially offsets their estimated relative wage disadvantage, but still left teachers with a significant total compensation gap of 16.7% in 2023, which is close to the 17.0% calculated in 2022. This slight improvement was due to a 0.5 percentage point change in the teacher benefits advantage, and a 0.2 percentage point change in the wage penalty.
The benefits advantage that favors teachers has grown considerably over the timeframe of study: It went from 2.4% in 1993 to 9.9% in 2023. However, the growing benefits advantage was not nearly enough to offset the much larger growth in the teacher wage penalty that grew from 2.7% to 26.6% over the same timeframe.
Final thoughts
Are teachers sufficiently compensated in the U.S. to retain current staff and recruit a pool of highly skilled college students into the profession? Not by a long shot. The trends this series has documented over the last two decades have no doubt had profound consequences on teacher retention and recruitment. Research related to the issues presented in this report has expanded considerably and grapples with the challenges facing public education and the teaching profession in the United States. This includes research on teacher staffing challenges (Fortin and Fawcett 2023; NCES 2023); college students forgoing teaching careers citing pay as a main barrier (Croft, Guffy, and Vitale 2018); parents actively steering their children into professions that pay better than teaching (PDK 2019); fast-tracking credentials in response to shortages of permanent teachers (Povich 2023); the heavy use of unqualified teachers (Tamez-Robledo 2023; Lopez and Van Overschelde 2024); and unqualified substitute teachers (Franco and Kemper Patrick 2023).
It is hard to think of a more consequential profession than teaching. Teachers have the future of the country in front of them daily. The quality of a public education greatly hinges on our efforts to take care of the teaching workforce and sufficiently fund schools. Too often and in too many places, we are failing to attain one of our highest ideals as a nation: our promise to educate every child without regard to means. This is a question of political will, with profound implications for our children, their families and communities, and the future of our nation.
About the author
Sylvia A. Allegretto is a senior economist at the Center for Economic and Policy Research and a research associate at the Economic Policy Institute. She worked for 15 years at the Institute for Research on Labor and Employment at the University of California, Berkeley, where she co-founded the Center on Wage and Employment Dynamics (CWED). CWED’s body of work on wage floors has been highly influential in academia and policy circles. Allegretto co-authored two editions of The State of Working America while at EPI and continues her work on teacher compensation, public education, and labor markets. Dr. Allegretto provides frequent commentary on economic trends. She has a Ph.D. in economics from the University of Colorado, Boulder.
Notes
1. See How Does Teacher Pay Compare (Allegretto, Corcoran, and Mishel 2004); The Teacher Penalty (Allegretto, Corcoran, and Mishel 2008); and the following issue briefs and reports in the series: Allegretto, Corcoran, and Mishel (2011); Allegretto and Tojerow (2014); Allegretto and Mishel (2016, 2018, and 2019); and Allegretto (2022 and 2023).
2. Allegretto and Mishel (2019, Appendix A) provides a comprehensive discussion of the data and methodologies that were used to produce our teacher weekly wage and total compensation estimates.
3. In Allegretto and Mishel (2019), we provide evidence that teachers work weekly hours similar to those of other professionals.
4. Our earlier work documents how the BLS imputation method overstates teacher earnings, which is not the case for the other college graduate sample (Allegretto, Corcoran, and Mishel 2008, 9).
5. For more about top-code adjustments, see Economic Policy Institute (2024b).
6. The wage model includes controls for both public and private school teachers. The weekly wage penalty estimates are based on the coefficient on the public school teacher indicator. Regression for all teachers includes a gender control. See Allegretto and Mishel (2019, Appendix A), for specification details.
7. See Allegretto, Corcoran, and Mishel (2008) for 1960, 1970, and 1980 estimates using decennial Census data.
8. Keep in mind that state estimates reported in this paper use pooled 2018–2023 CPS data, while the state results reported in the previous paper (Allegretto 2023) used pooled 2017–2022 CPS data. Thus, there is significant overlap of data.
9. The ECEC provides compensation data for a narrower category of “primary, secondary, and special education school teachers” and for a broader category of “teachers.” I analyze the narrower category, which closely matches the definition of teachers in the CPS-ORG data, using data limited to state and local public-sector workers. The inclusion of kindergarten and special education teachers in the benefits analysis does not produce any more substantial differences than if they were excluded (as they are in the CPS sample used to estimate the wage penalty). Greater methodological detail is provided in Appendix A of Allegretto and Mishel (2019).
10. My analysis accounts for differences in annual weeks worked, as it is based on the usual weekly wages of teachers and other college graduates, not hourly wages or annual earnings. One reason health and pension costs are higher for teachers is that teacher health benefits are provided for a full year, while teacher salaries are for less than a full year.
References
Allegretto, Sylvia A. 2022. The Teacher Pay Penalty Has Hit a New High. Economic Policy Institute, August 2022.
Allegretto, Sylvia A. 2023. The Teacher Pay Penalty Still Looms Large. Economic Policy Institute, September 2023.
Allegretto, Sylvia A., Sean P. Corcoran, and Lawrence Mishel. 2004. How Does Teacher Pay Compare? Methodological Challenges and Answers. Washington, D.C.: Economic Policy Institute.
Allegretto, Sylvia A., Sean P. Corcoran, and Lawrence Mishel. 2008. The Teaching Penalty: Teacher Pay Losing Ground. Washington, D.C.: Economic Policy Institute.
Allegretto, Sylvia A., Sean P. Corcoran, and Lawrence Mishel. 2011. The Teaching Penalty: An Update Through 2010. Economic Policy Institute, March 2011.
Allegretto, Sylvia A., Emma García, and Elaine Weiss. 2022. Public Education Funding in the U.S. Needs an Overhaul: How a Larger Federal Role Would Boost Equity and Shield Children from Disinvestment During Downturns. Economic Policy Institute, July 2022.
Allegretto, Sylvia A., and Lawrence Mishel. 2016. The Teacher Pay Gap Is Wider Than Ever: Teachers’ Pay Continues to Fall Further Behind Pay of Comparable Workers. Economic Policy Institute, August 2016.
Allegretto, Sylvia A., and Lawrence Mishel. 2018. The Teacher Pay Penalty Has Hit a New High: Trends in the Teacher Wage and Compensation Gaps Through 2017. Economic Policy Institute, September 2018.
Allegretto, Sylvia A., and Lawrence Mishel. 2019. The Teacher Weekly Wage Penalty Hit 21.4 Percent in 2018, a Record High. Economic Policy Institute, April 2019.
Allegretto, Sylvia A., and Ilan Tojerow. 2014. “Teacher Staffing and Pay Differences: Public and Private Schools.” Monthly Labor Review (U.S. Department of Labor, Bureau of Labor Statistics), September 2014.
Bureau of Labor Statistics (BLS). 2024a. Current Population Survey.
Bureau of Labor Statistics (BLS). 2024b. Employer Costs for Employee Compensation Historical Listing: National Compensation Survey, data tables accessed July 11, 2024.
Croft, Michelle, Gretchen Guffy, and Dan Vitale. 2018. Encouraging More High School Students to Consider Teaching. ACT Research & Policy, June 2018.
Economic Policy Institute (EPI). 2024a. Current Population Survey Extracts, Version 1.0.53, https://microdata.epi.org. Accessed July 1, 2024.
Economic Policy Institute (EPI). 2024b. “Methodology: Wage Variables.” EPI Microdata Extracts documentation.
Fortin, Jacey, and Eliza Fawcett. 2023. “How Bad Is the Teacher Shortage? Depends Where You Live.” New York Times, August 29, 2023.
Franco, Marguerite, and Susan Kemper Patrick. 2023. State Teacher Shortages: Teaching Positions Left Vacant or Filled by Teachers Without Full Certification. Learning Policy Institute, July 2023.
Lopez, Minda, and James P. Van Overschelde. 2024. “Unlicensed Teachers Now Dominate New Teacher Hires in Rural Texas Schools.” The Conversation (Texas State University), May 6, 2024.
National Center for Education Statistics (NCES). 2023. Most Public Schools Face Challenges in Hiring Teachers and Other Personnel Entering the 2023–24 Academic Year. October 2023.
Phi Delta Kappan (PDK). 2018. Teaching: Respect but Dwindling Appeal. The 50th Annual PDK Poll of the Public’s Attitudes Toward the Public Schools. Supplement to Kappan magazine.
Povich, Elaine S. 2023. “Plagued By Teacher Shortages, Some States Turn to Fast-Track Credentialing.” Stateline, July 24, 2023.
Tamez-Robledo, Nadia. 2023. “These States Have the Most ‘Underqualified’ Teachers Stepping in to Fill Open Positions.” EdSurge, April 4, 2023.