Full Report
To provide economic security and stability for workers and families, a good job must pay a living wage and provide workers with health insurance, a pension, and the flexibility they need to balance work and family demands. In this report, we show that workers across the South are much less likely than their counterparts in other regions to have access to these kinds of jobs. The data suggest that a key reason for the disadvantages Southern workers face is the Southern economic development model prevailing across the region. The Southern economic development model is characterized by low wages, limited regulations on businesses, a regressive tax system, subsidies that funnel tax dollars to the wealthy and corporations, a weak safety net, and staunchly anti-union policies and practices (Childers 2024a).
Proponents of the Southern economic development model argue that it will create good jobs (Danney 2021; Ivey 2024). They claim that adopting most or all components of the model creates a business-friendly environment with low taxes, which will attract businesses (including major corporations) that will in turn provide an abundance of jobs. In theory, if jobs were abundant and/or growing faster than the population, competition among employers to attract and retain workers would lead them to raise pay, improve benefits (including health insurance and pensions), and find other ways to make these jobs more attractive.
However, Childers (2023; 2024b) finds that job growth across the South has not kept pace with growth in the working-age population. Further, she finds that the share of the prime-working-age population that was employed—the prime-age employment-to-population ratio—was lower across the South than in any other region of the country (Childers 2024b). This reflects many factors, including a lack of access to affordable childcare and reliable public transportation that helps workers get and keep jobs. It also reflects the fact that Southern states incarcerate their residents at very high rates, which translate into large numbers of Southerners with criminal histories. Finally, many available jobs are unattractive and do not provide workers with the income and benefits needed to support themselves or their families.
In this report we explicitly examine the argument that the Southern economic development model produces good jobs for workers across the region.1 The data show that wages and access to benefits such as health insurance and pensions in Southern states that embrace the Southern model lag those of workers in other regions that do not adopt any or most of the model’s components. The Southern economic development model does not—and cannot—lift all Southerners to economic security or prosperity.
Southern states consistently have the lowest wages of any region
Southern states have lower median wages than other regions
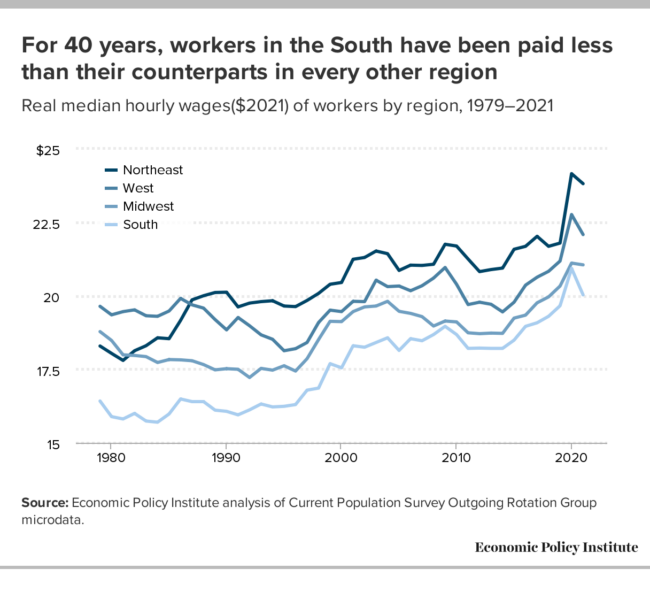
For over 40 years, the typical worker in the South has been paid less than their counterparts in every other region of the country. Figure A shows the median hourly wage for workers by region since 1979 in constant 2021 dollars. The median wage is the wage of the worker in the exact middle of the wage distribution: This worker is paid more than half the workforce and less than the other half.
In 1979, the median Southern worker was paid the equivalent of $16.42 per hour in 2021 dollars. This is 16.4% less per hour than their counterparts in the West, the region with the highest median wages in 1979. It was also 12.6% and 10.2% lower than the wages of workers in the Midwest and Northeast, respectively. Median wages have risen nationwide since 1979, with growth ranging from 12.1% in the Midwest, 12.4% in the West, 22% in the South, and 30.2% in the Northeast by 2021, as shown in Figure A.
Since the early 1980s, the Midwest has consistently had the second-lowest wages, but over time the gap between the South and the Midwest has somewhat closed; wages in the South were only 4.8% lower than Midwest wages in 2021. However, wages in the South have never been as high as those in other regions. They remained substantially lower in 2021, when they were 9.3% lower than wages in the West and 15.9% lower than wages in the Northeast—regions where most state governments have rejected the Southern economic development model. In fact, the gap between typical wages in the South and the Northeast in 2021 is roughly the same as the gap between the South and West in 1979—meaning that the Southern model has not afforded any advantage in pay to workers in the South relative to workers in other regions over the last 40 years. Instead, the Southern model has ensured that eight of the 10 lowest-wage states in 2021 were in the South: Arkansas, Kentucky, Louisiana, Mississippi, Oklahoma, South Carolina, Tennessee, and West Virginia.2
For 40 years, workers in the South have been paid less than their counterparts in every other region: Real median hourly wages ($2021) of workers by region, 1979–2021
| Year | South | West | Northeast | Midwest |
|---|---|---|---|---|
| 1979 | $16.42 | $19.64 | $18.29 | $18.78 |
| 1980 | $15.89 | $19.35 | $18.04 | $18.48 |
| 1981 | $15.81 | $19.46 | $17.80 | $17.99 |
| 1982 | $16.00 | $19.52 | $18.13 | $17.97 |
| 1983 | $15.74 | $19.32 | $18.30 | $17.93 |
| 1984 | $15.70 | $19.30 | $18.57 | $17.73 |
| 1985 | $15.98 | $19.48 | $18.54 | $17.83 |
| 1986 | $16.49 | $19.91 | $19.16 | $17.82 |
| 1987 | $16.40 | $19.69 | $19.86 | $17.79 |
| 1988 | $16.40 | $19.58 | $20.00 | $17.66 |
| 1989 | $16.11 | $19.19 | $20.11 | $17.48 |
| 1990 | $16.07 | $18.84 | $20.12 | $17.52 |
| 1991 | $15.95 | $19.26 | $19.62 | $17.50 |
| 1992 | $16.12 | $18.98 | $19.75 | $17.22 |
| 1993 | $16.32 | $18.67 | $19.80 | $17.53 |
| 1994 | $16.22 | $18.52 | $19.83 | $17.47 |
| 1995 | $16.24 | $18.13 | $19.65 | $17.62 |
| 1996 | $16.30 | $18.20 | $19.63 | $17.44 |
| 1997 | $16.79 | $18.41 | $19.84 | $17.86 |
| 1998 | $16.86 | $19.09 | $20.08 | $18.51 |
| 1999 | $17.69 | $19.51 | $20.39 | $19.13 |
| 2000 | $17.55 | $19.46 | $20.45 | $19.12 |
| 2001 | $18.30 | $19.81 | $21.24 | $19.46 |
| 2002 | $18.25 | $19.80 | $21.30 | $19.62 |
| 2003 | $18.41 | $20.53 | $21.52 | $19.65 |
| 2004 | $18.57 | $20.31 | $21.43 | $19.81 |
| 2005 | $18.14 | $20.33 | $20.86 | $19.47 |
| 2006 | $18.54 | $20.17 | $21.04 | $19.40 |
| 2007 | $18.47 | $20.34 | $21.03 | $19.29 |
| 2008 | $18.68 | $20.60 | $21.07 | $18.97 |
| 2009 | $18.96 | $20.96 | $21.75 | $19.14 |
| 2010 | $18.68 | $20.39 | $21.69 | $19.11 |
| 2011 | $18.21 | $19.70 | $21.25 | $18.74 |
| 2012 | $18.22 | $19.78 | $20.82 | $18.71 |
| 2013 | $18.21 | $19.71 | $20.89 | $18.73 |
| 2014 | $18.21 | $19.45 | $20.94 | $18.72 |
| 2015 | $18.49 | $19.78 | $21.58 | $19.24 |
| 2016 | $18.96 | $20.36 | $21.68 | $19.34 |
| 2017 | $19.08 | $20.63 | $22.02 | $19.76 |
| 2018 | $19.30 | $20.83 | $21.68 | $19.96 |
| 2019 | $19.66 | $21.18 | $21.79 | $20.33 |
| 2020 | $20.93 | $22.76 | $24.15 | $21.11 |
| 2021 | $20.03 | $22.08 | $23.81 | $21.05 |
Note: All dollar amounts are in constant 2021 dollars.
Source: EPI analysis of Current Population Survey Outgoing Rotation Group (ORG) microdata.
Low-wage workers make up a larger share of the workforce across the South
While the median wage is an important indicator of the economic well-being of workers overall, it does not tell us how particular groups of workers are faring, such as the low-wage workforce. The low-wage workforce here is defined as workers that are paid less than $15 per hour. Figure B shows the share of workers that are paid less than $15 per hour in each region.
More than one in five workers in the South are paid less than $15 per hour: Share of workers paid less than $15 per hour by region, 2019 and 2021
| 2021 | 2019 | |
|---|---|---|
| Northeast | 11.5% | 17.4% |
| West | 9.7% | 17.5% |
| Midwest | 16.6% | 22.2% |
| South | 22.0% | 26.0% |
Source: EPI analysis of CPS ORG microdata.
The share of the workforce made up of low-wage workers has fallen nationwide since the COVID-19 recession. In 2019, before the pandemic, the share of workers in the South that were paid less than $15 per hour was 26%—more than one in four workers. This is a much higher share than other regions; in the Midwest, 22.2% of workers were part of the low-wage workforce, and fewer than one in five workers in the Northeast and West made up that share.
After the pandemic, a period when strong labor market conditions gave workers leverage to command a higher wage and many states were raising their minimum wages, the share of workers that were paid less than $15 per hour fell in all regions (Gould and deCourcy 2023). However, the smallest decline was in the South. The share of workers paid less than $15 per hour fell from 26% of workers to 22%, a decline of just four percentage points. There were much larger declines in the share of workers that were paid low wages in the Midwest (5.6 percentage points), the Northeast (5.9), and the West (7.8).
In many Southern states more than one in five workers are paid less than $15 per hour: Share of workers paid less than $15 per hour by state, 2023
| State | Share earning less than $15/hr |
|---|---|
| Alabama | 22% |
| Alaska | 6% |
| Arizona | 12% |
| Arkansas | 23% |
| California | n/a |
| Colorado | 7% |
| Connecticut | n/a |
| Delaware | 13% |
| Washington D.C. | n/a |
| Florida | 19% |
| Georgia | 19% |
| Hawaii | 15% |
| Idaho | 16% |
| Illinois | 11% |
| Indiana | 14% |
| Iowa | 16% |
| Kansas | 17% |
| Kentucky | 19% |
| Louisiana | 27% |
| Maine | 9% |
| Maryland | 9% |
| Massachusetts | n/a |
| Michigan | 14% |
| Minnesota | 7% |
| Mississippi | 29% |
| Missouri | 15% |
| Montana | 14% |
| Nebraska | 13% |
| Nevada | 15% |
| New Hampshire | 9% |
| New Jersey | n/a |
| New Mexico | 21% |
| New York | n/a |
| North Carolina | 19% |
| North Dakota | 9% |
| Ohio | 14% |
| Oklahoma | 24% |
| Oregon | n/a |
| Pennsylvania | 14% |
| Rhode Island | 9% |
| South Carolina | 19% |
| South Dakota | 12% |
| Tennessee | 18% |
| Texas | 19% |
| Utah | 13% |
| Vermont | 7% |
| Virginia | 12% |
| Washington | n/a |
| West Virginia | 23% |
| Wisconsin | 12% |
| Wyoming | 18% |
Notes: Analysis of the Economic Policy Institute Current Population Survey extracts, January 2023 through December 2023. Wages include overtime, tips, and commissions. Data is not shown for states where the minimum wage is less than $1 above $15.00.
Source: Low Wage Workforce Tracker, Economic Policy Institute, January 2024.
Figure C shows the share of workers that are part of the low-wage workforce in each state (see also EPI 2024a). These data show that the differences between regions are not driven by a few outlier states. In several Southern states—Mississippi (29%), Louisiana (27%), Oklahoma (24%), Arkansas (23%), West Virginia (23%), and Alabama (22%)—the share of the workforce that is low wage is higher than that of the region as a whole (22%). Delaware (13%), Virginia (12%), and Maryland (9%), however, have the smallest low-wage workforces of all states across the South. Notably, although these states are part of the South Census Region, their state economic policies tend to be more in line with those of Northeastern and Western states.
Outside the South, New Mexico (21%) is the only state with more than one in five workers paid less than $15 per hour. In New Hampshire and North Dakota, just 9% of workers are low-wage workers. Even fewer workers receive such low pay in Alaska (6%), Colorado (7%), Minnesota (7%), and Vermont (7%).
Every state that lacks a state minimum wage is in the South
Many states with smaller low-wage workforces have accomplished this by raising their state minimum wage above the federal minimum wage, which has been stuck at $7.25 per hour since 2009. The value of the federal minimum wage has fallen such that it has less purchasing power today than it has had at any time since 1956 (Cooper, Hickey, and Zipperer 2022).
As federal policymakers have left the federal minimum wage to erode, policymakers in most states have raised their state minimum wages, as have lawmakers in nearly 60 cities and counties—raising pay for their state’s low-wage workers (EPI 2024b; Hickey 2023). The federal minimum wage is a floor for wages; workers generally must be paid at or above this rate.3 For example, in California, Connecticut, D.C., Maryland, Massachusetts, New Jersey, New York, and Washington, the minimum wage is $15 or higher, ensuring workers in these states are paid decent wages.
In Figure D, the data show that across the South, many states have chosen not to raise their state minimum wage above the federal minimum wage. One Southern state—Georgia—has a minimum wage lower than the federal minimum wage, while Kentucky, North Carolina, Oklahoma, and Texas have state minimum wages equal to the federal minimum wage. Five Southern states—Alabama, Louisiana, Mississippi, South Carolina, and Tennessee—have no state minimum wage at all. It is important to note that nationally, only these five states completely lack a state minimum wage.
Ten Southern states have state minimum wages at or below the federal level: Minimum wage rates by state, 2024
| State | Minimum wage |
|---|---|
| Alabama | $7.25 |
| Alaska | $11.73 |
| Arizona | $14.35 |
| Arkansas | $11.00 |
| California | $16.00 |
| Colorado | $14.42 |
| Connecticut | $15.69 |
| Delaware | $13.25 |
| Washington D.C. | $17.00 |
| Florida | $12.00 |
| Georgia | $5.15 |
| Hawaii | $14.00 |
| Idaho | $7.25 |
| Illinois | $14.00 |
| Indiana | $7.25 |
| Iowa | $7.25 |
| Kansas | $7.25 |
| Kentucky | $7.25 |
| Louisiana | $7.25 |
| Maine | $14.15 |
| Maryland | $15.00 |
| Massachusetts | $15.00 |
| Michigan | $10.33 |
| Minnesota | $10.85 |
| Mississippi | $7.25 |
| Missouri | $12.30 |
| Montana | $10.30 |
| Nebraska | $12.00 |
| Nevada | $11.25 |
| New Hampshire | $7.25 |
| New Jersey | $15.13 |
| New Mexico | $12.00 |
| New York | $15.00 |
| North Carolina | $7.25 |
| North Dakota | $7.25 |
| Ohio | $10.45 |
| Oklahoma | $7.25 |
| Oregon | $14.20 |
| Pennsylvania | $7.25 |
| Rhode Island | $14.00 |
| South Carolina | $7.25 |
| South Dakota | $11.20 |
| Tennessee | $7.25 |
| Texas | $7.25 |
| Utah | $7.25 |
| Vermont | $13.67 |
| Virginia | $12.00 |
| Washington | $16.28 |
| West Virginia | $8.75 |
| Wisconsin | $7.25 |
| Wyoming | $7.25 |
Notes: Alabama, Louisiana, Mississippi, South Carolina, and Tennessee do not have a state minimum wage. Georgia’s state minimum wage is $5.15. Wyoming—a state outside the South—also has a $5.15 minimum wage. In these states, the federal minimum wage of $7.25 applies.
Source: Minimum Wage Tracker, Economic Policy Institute, February 2024.
In addition to Maryland and D.C. that have minimum wages of $15 or higher, several other Southern states have minimum wages above the federal level but below $15. Not all were the result of actions by policymakers. The District of Columbia ($17), Maryland ($15), Delaware ($13.25), Virginia ($12), and West Virginia ($8.75) all have higher minimum wages as the result of legislation or a city council ordinance. In Florida ($12) and Arkansas ($11), higher minimum wages were the result of a ballot measure (EPI 2024b; FPI 2024; Hickey 2023).
It is also important to note that 19 states across the country have indexed their minimum wages for inflation, so that the minimum wages are adjusted each year to account for rises in inflation. Of these 19 states, only Florida, Virginia, and the District of Columbia are in the South (EPI 2024b).
These data illustrate the importance of state policies for the economic well-being of workers and their families. They also show the failure of the policies that make up the Southern economic development model. This model has failed to ensure that workers are paid enough to lift a family out of poverty, and has certainly failed to ensure workers’ economic security, especially in states with more than one in five workers paid less than $15 per hour. Even workers in the middle of the earnings distribution have been paid less than their counterparts in other regions over the last four decades.
Adjusting wages for differences in the cost of living still leaves workers across the South with lower earnings
The wage data presented thus far show that the Southern economic development model has not provided any real regional advantage to workers, with unremarkable growth in typical wages and a larger share of the workforce paid particularly low wages. Yet proponents of the Southern model argue that a lower cost of living in the South means that lower nominal wages still afford a higher quality of life. Alternatively, they argue that an abundance of jobs means there is more work to be had, and lower hourly wages might be offset by greater hours of work annually. Neither of these arguments has merit.
Figure E shows a map with the nominal median annual earnings and the median annual earnings adjusted for differences in the cost of living for all 50 states. Median 2022 earnings are adjusted using the regional purchasing power parity index from the Bureau of Economic Analysis (2023). This allows us to compare the real purchasing power of a typical workers’ annual pay across states, as if the overall cost of living (i.e., prices) were the same across the country.
Workers in Southern states are paid less than those in other regions, even when adjusted for regional cost of living: State median earnings adjusted for state differences in the cost of living, 2022
| State | 2022 earnings for FTYR Workers | 2022 COL-Adjusted Earnings |
|---|---|---|
| Alabama | $49,599 | $56,491 |
| Alaska | $62,595 | $61,368 |
| Arizona | $53,811 | $53,865 |
| Arkansas | $46,012 | $53,132 |
| California | $63,399 | $56,355 |
| Colorado | $63,809 | $62,374 |
| Connecticut | $69,869 | $65,666 |
| Delaware | $57,010 | $58,173 |
| Washington D.C. | ||
| Florida | $50,628 | $49,587 |
| Georgia | $53,186 | $55,518 |
| Hawaii | $58,626 | $52,912 |
| Idaho | $50,955 | $55,507 |
| Illinois | $60,437 | $59,661 |
| Indiana | $52,796 | $57,512 |
| Iowa | $53,907 | $60,981 |
| Kansas | $52,085 | $57,872 |
| Kentucky | $50,066 | $56,002 |
| Louisiana | $50,088 | $55,285 |
| Maine | $54,040 | $53,611 |
| Maryland | $69,530 | $66,219 |
| Massachusetts | $73,999 | $67,641 |
| Michigan | $55,432 | $59,349 |
| Minnesota | $62,485 | $63,956 |
| Mississippi | $44,499 | $50,973 |
| Missouri | $51,426 | $56,450 |
| Montana | $50,404 | $55,818 |
| Nebraska | $53,767 | $59,874 |
| Nevada | $50,902 | $52,803 |
| New Hampshire | $64,517 | $59,960 |
| New Jersey | $70,215 | $64,536 |
| New Mexico | $49,831 | $54,759 |
| New York | $64,583 | $60,021 |
| North Carolina | $51,729 | $54,914 |
| North Dakota | $55,044 | $62,056 |
| Ohio | $54,731 | $59,815 |
| Oklahoma | $47,623 | $53,630 |
| Oregon | $58,569 | $54,943 |
| Pennsylvania | $58,360 | $60,665 |
| Rhode Island | $62,628 | $59,817 |
| South Carolina | $50,184 | $53,615 |
| South Dakota | $50,930 | $57,875 |
| Tennessee | $50,788 | $55,325 |
| Texas | $53,944 | $55,327 |
| Utah | $58,019 | $61,396 |
| Vermont | $58,760 | $58,121 |
| Virginia | $63,583 | $62,275 |
| Washington | $69,439 | $63,241 |
| West Virginia | $49,650 | $55,661 |
| Wisconsin | $55,334 | $59,950 |
| Wyoming | $54,398 | $59,193 |
Notes: The cost-of-living-adjusted median earnings is the median annual earnings for each state normalized by the BEA’s Regional Price Parities index. The values effectively show what each state’s median earnings can afford if the cost of living was identical across all states.
Sources: Unadjusted 2022 median earnings for full-time, year-round workers by state are taken from the American Community Survey Table S2001. Regional Price Parities for 2022 are taken from the U.S. Department of Commerce, Bureau of Economic Analysis Regional Price Parity by State and Metropolitan Statistical Areas.
Figure E shows that adjusting for state-level differences in the cost of living has a substantial impact on our understanding of the purchasing power of workers in different states. States with extremely high costs of living such as New York, California, and Hawaii have lower relative earnings—i.e., the purchasing power of each of their dollars is lower—when we take the higher cost of living into account. The high costs of living in these states are typically driven by an inadequate housing supply, a problem less acute in Southern states, where an abundance of land and limited regulation of housing development has resulted in sprawling growth in and around many Southern cities. Thus, it is true that despite lower relative earnings in many Southern states, their dollars provide them with greater purchasing power than the nominal value of those dollars would suggest. Median annual earnings of $44,499 in Mississippi have about the same purchasing power as $54,040 in Maine or $53,811 in Arizona.
Even when state-level differences in the cost of living are considered, Southern states continue to have some of the lowest wages in the country. Only two Southern states—Maryland and Virginia—are among the 10 highest-earning states.4 And among the 10 states with the lowest cost-of-living-adjusted median earnings, half are Southern states. Of the Southern states with the lowest earnings, Florida has the lowest of all states, followed by Mississippi, Arkansas, South Carolina, and Oklahoma.
As for the arguments that the Southern economic development model will generate more jobs or that workers can work more hours to increase their earnings, neither of these claims are reflected in the data. Childers (2023; 2024b) showed that job growth across the South has not been able to keep up with growth in the working-age population since the early 2000s and only moved in tandem with population growth before the 2000s. This indicates that the Southern economic development model has failed to outperform other regions that did not adopt this model. Further, the share of the prime-age population (ages 25–54) that is employed is lower across the South than in other regions. For example, of the 10 states with the lowest prime-age employment-to-population ratio (EPOP), seven—Alabama, Arkansas, Kentucky, Louisiana, Mississippi, Oklahoma, and West Virginia—are Southern states (Childers 2024b). Finally, analysis of Current Population Survey data on the average number of family hours of work across states shows that Southern states tend to have fewer hours of work per family relative to states in other regions. In 2019, before the pandemic, six of the 10 states with the fewest numbers of work hours were in the South: Alabama, Arkansas, Louisiana, Mississippi, South Carolina, and West Virginia. Of the 10 states with the highest number of work hours, only Maryland is in the South (Appendix Table 2).
These data show that the Southern economic development model is not providing the promised benefits to workers and families across the South. What the model has done is to ensure lower wages for workers across the region.
Employer-provided benefits
Although probably the most salient for most workers, earnings are just one component of job quality. Other crucial aspects of job quality are also influenced by, if not directly shaped by, the state and local political environment and policy choices. These include workers’ access to an employer-provided pension, coverage by employer-provided health insurance, access to paid leave, and ability to form unions.
Fewer and fewer workers have been covered by employer-provided health insurance over the last 30 years
The primary way that most working-age adults and their families receive health insurance is through employer-provided coverage (Keisler-Starkey and Bunch 2023). Figure F shows trends in the share of private-sector workers working at least 20 hours per week and 26 weeks per year who have employer-provided health insurance, starting in 1981. The dramatic decline in health insurance coverage across regions is quite striking, illustrating a decline in this measure of job quality overall.
Private-sector workers across the South are the least likely to have employer-provided health insurance, and the share with it has declined dramatically over the last four decades: Employer-provided health insurance coverage by region
| Year | South | Midwest | Northeast | West |
|---|---|---|---|---|
| 1981 | 64.5% | 71.6% | 71.7% | 68.0% |
| 1982 | 65.6% | 71.0% | 72.0% | 68.6% |
| 1983 | 65.5% | 70.2% | 71.8% | 68.2% |
| 1984 | 64.3% | 69.2% | 71.0% | 66.8% |
| 1985 | 63.2% | 68.5% | 70.6% | 65.7% |
| 1986 | 62.3% | 67.7% | 70.2% | 64.7% |
| 1987 | 61.0% | 65.9% | 69.1% | 62.7% |
| 1988 | 59.0% | 64.4% | 67.8% | 60.5% |
| 1989 | 57.6% | 63.1% | 66.2% | 58.7% |
| 1990 | 56.7% | 62.9% | 65.0% | 58.1% |
| 1991 | 56.0% | 62.5% | 64.0% | 58.1% |
| 1992 | 54.5% | 61.7% | 63.3% | 57.3% |
| 1993 | 54.4% | 61.5% | 63.1% | 56.8% |
| 1994 | 54.3% | 61.4% | 62.3% | 56.3% |
| 1995 | 54.5% | 61.5% | 62.1% | 56.0% |
| 1996 | 55.0% | 61.5% | 61.6% | 55.9% |
| 1997 | 55.1% | 61.1% | 61.0% | 55.7% |
| 1998 | 55.5% | 61.3% | 59.9% | 56.1% |
| 1999 | 55.2% | 61.4% | 59.5% | 56.3% |
| 2000 | 55.7% | 61.6% | 59.8% | 56.5% |
| 2001 | 55.8% | 61.0% | 60.0% | 56.2% |
| 2002 | 55.4% | 60.2% | 59.5% | 56.0% |
| 2003 | 54.6% | 59.6% | 58.5% | 55.4% |
| 2004 | 53.7% | 59.0% | 57.6% | 55.0% |
| 2005 | 53.1% | 58.4% | 56.9% | 53.9% |
| 2006 | 52.4% | 58.1% | 56.5% | 53.8% |
| 2007 | 52.2% | 57.8% | 56.3% | 54.0% |
| 2008 | 52.0% | 57.7% | 56.5% | 54.7% |
| 2009 | 51.6% | 56.9% | 56.1% | 54.6% |
| 2010 | 50.9% | 56.0% | 55.8% | 54.0% |
| 2011 | 50.1% | 55.1% | 54.9% | 52.8% |
| 2012 | 49.6% | 54.5% | 54.2% | 51.8% |
| 2013 | 49.2% | 54.8% | 54.0% | 51.7% |
| 2014 | 49.4% | 54.5% | 54.3% | 51.7% |
| 2015 | 49.7% | 54.5% | 54.5% | 52.2% |
| 2016 | 50.2% | 54.0% | 54.3% | 52.3% |
| 2017 | 50.5% | 54.5% | 54.3% | 52.9% |
| 2018 | 50.3% | 54.7% | 53.9% | 52.9% |
| 2019 | 50.7% | 55.0% | 53.9% | 52.5% |
Note: All private-sector wage and salary workers aged 16 and older who worked at least 20 hours per week and 26 weeks per year. Data for each year is a three-year moving average.
Source: EPI analysis of CPS March supplement.
In 1981, 68.7% of working Americans had employer-provided health insurance. While rates were higher in the Northeast (71.7%) and Midwest (71.6%), they were slightly lower in the West (68%) and substantially lower in the South (64.5%). Over the following 30 years, however, far fewer workers were covered by employer-provided health insurance across all regions. Coverage nationally fell to 52.6% in 2019, but coverage rates in the West (52.5%) and the South (50.7%) remained lower than the national rate, and the rates in the Midwest (55%) and the Northeast (53.9%) remained higher. As Figure F shows, the differences among regions have declined, but workers in Southern states are consistently the least likely to have employer-provided health insurance coverage.
The share of workers with a pension is declining across regions, but workers across the South remain the least likely to have one
Historically, many jobs that were considered good jobs provided workers with a traditional pension. A traditional pension is often referred to as a defined benefit plan, because the benefit that the worker will receive is defined upon hire. Because pensions offer a guaranteed, stable income—unaffected by swings in the stock market—these plans provide workers with economic security after they retire. Pensions have long been considered one leg of the three-legged stool that is supposed to support workers in retirement. The remaining two legs are personal savings and social security (DeWitt 1996). Unfortunately, large segments of the working population are paid such low wages that they are unable to save any significant amount of money for retirement. Figure G shows that access to an employer-provided pension has also declined precipitously across all regions, but workers across the South have consistently been less likely than their counterparts in the Midwest and Northeast to receive a pension over the last 40 years, beginning in the early 1980s, when they were the absolute least likely of workers in any region.
In 1981, almost half of private-sector workers—48.9%—had a pension. The rates were higher in the Midwest (53.6%) and the Northeast (53.6%). They were lower in the West (45.5%) and the South (43.7%). By 2019 there had been a precipitous decline in the share of workers covered by a pension, leaving just 32.5% of workers in the country with a pension. There was a decline across all regions, resulting in 38.4% of workers in the Midwest, 33.8% in the Northeast, 31.1% in the West, and 29.4% in the South having a pension.
Private-sector workers across the South are the least likely to have an employer-provided pension plan compared with workers in other regions: Share of workers receiving an employer-provided pension by region, 1981–2019
| South | Midwest | West | Northeast | |
|---|---|---|---|---|
| 1981 | 43.7% | 53.6% | 45.5% | 53.6% |
| 1983 | 42.9% | 51.7% | 43.7% | 52.5% |
| 1984 | 42.1% | 50.8% | 42.7% | 51.6% |
| 1985 | 41.8% | 50.2% | 42.3% | 50.5% |
| 1986 | 41.0% | 49.9% | 41.2% | 49.7% |
| 1987 | 40.4% | 48.9% | 39.9% | 48.2% |
| 1988 | 39.3% | 48.0% | 38.0% | 47.4% |
| 1989 | 39.3% | 47.0% | 37.5% | 46.6% |
| 1990 | 39.7% | 47.9% | 37.4% | 47.3% |
| 1991 | 40.5% | 48.4% | 38.0% | 47.6% |
| 1992 | 40.9% | 48.7% | 38.5% | 47.9% |
| 1993 | 40.9% | 48.7% | 39.0% | 47.4% |
| 1994 | 41.3% | 49.0% | 39.5% | 47.7% |
| 1995 | 41.3% | 49.9% | 40.0% | 48.3% |
| 1996 | 42.0% | 51.3% | 41.4% | 49.2% |
| 1997 | 42.2% | 52.6% | 41.9% | 49.1% |
| 1998 | 43.2% | 53.5% | 42.9% | 49.4% |
| 1999 | 43.9% | 54.3% | 42.9% | 49.7% |
| 2000 | 44.5% | 54.5% | 42.9% | 50.7% |
| 2001 | 44.2% | 53.8% | 42.0% | 50.6% |
| 2002 | 43.6% | 52.3% | 41.1% | 49.7% |
| 2003 | 42.9% | 51.2% | 40.9% | 48.6% |
| 2004 | 42.2% | 50.9% | 40.7% | 48.0% |
| 2005 | 41.4% | 50.7% | 40.4% | 48.0% |
| 2006 | 40.1% | 50.2% | 39.6% | 46.8% |
| 2007 | 39.8% | 50.2% | 39.7% | 45.9% |
| 2008 | 39.4% | 50.1% | 40.2% | 45.1% |
| 2009 | 39.4% | 50.0% | 40.6% | 44.9% |
| 2010 | 39.0% | 48.8% | 40.3% | 44.8% |
| 2011 | 39.0% | 48.0% | 39.7% | 44.7% |
| 2012 | 39.2% | 47.5% | 39.5% | 45.3% |
| 2013 | 37.6% | 46.4% | 38.9% | 44.1% |
| 2014 | 35.6% | 44.7% | 37.7% | 42.1% |
| 2015 | 32.8% | 41.5% | 35.4% | 39.0% |
| 2016 | 30.6% | 39.3% | 32.8% | 37.0% |
| 2017 | 29.2% | 37.9% | 31.7% | 35.8% |
| 2018 | 28.6% | 38.1% | 31.4% | 34.6% |
| 2019 | 29.4% | 38.4% | 31.1% | 33.8% |
Note: All private-sector wage and salary workers aged 16 and older who worked at least 20 hours per week and 26 weeks per year. Data for each year is a three-year moving average.
Source: EPI analysis of Current Population Survey, Annual Social and Economic Supplement.
These declines in pension coverage are occurring at a time when the share of the population 65 and older has been increasing. The South has the largest number of people aged 65 or older—21.1 million—compared with 12.6 million in the West, 11.9 million in the Midwest, and 10.2 million in the Northeast. The South (42%) and the West (46.9%) are also experiencing the fastest growth in their 65-and-older population, with somewhat slower growth in the Midwest (31.8%) and Northeast (30.7%) (Caplan and Rabe 2023). The growth of the 65-and-older population includes retirees who relocate to the South from other regions. Of the three states with an increase of over one million in the 65-and-older population between 2010 and 2020, two—Florida and Texas—are in the South (Caplan and Rabe 2023).5
While many of these workers may have access to a 401(k) plan, also known as a defined contribution plan, these plans are a far less reliable income source than the defined benefit pension. These plans are called defined contribution plans because it is the employer’s contribution to the plan that is determined at the beginning of the employment relationship—and the employer’s contribution can be $0—rather than defining the benefit the employee will receive, as with the defined benefit pension (Morrissey 2016). When employers do contribute to the plan, they will often only match the amount the employee contributes up to a specific percentage of the employee’s salary. According to National Association of Plan Advisors (2017), it is most common for employers to contribute up to 6% of an employee’s salary to their 401(k). If the employee’s earnings are too low to participate, the employer typically does not contribute. Also, unlike pensions, where the employer is responsible for ensuring workers receive a predictable stream of income in retirement, the 401(k) shifts responsibility for the investment decisions and the associated risks onto the worker. This shift ultimately means less economic security in retirement for many of today’s workers.
Workers across the South have less access to paid leave than their peers in other regions
Paid sick leave
Access to paid sick leave and paid family and medical leave are crucial indicators of job quality. Paid sick leave ensures that workers can take time off from work if they or a family member are sick, have an injury, or need to seek medical treatment. Because there are no federal laws guaranteeing paid sick leave, in states and localities that do not have laws requiring paid leave, employers decide whether workers will be paid. Unfortunately, low-wage workers are much less likely to be offered paid time off than workers in better-paying jobs (Gould and Wething 2023). Low-wage workers are also often the least likely to be able to afford to lose their wages. This means that many go to work when they are sick or send their children to school sick, endangering public health. For example, one survey found that seven in 10 women working in the fast-food industry had gone to work when they were sick—coughing, sneezing, with a fever, or vomiting—because they did not have paid leave (National Partnership 2016). Thus, paid sick leave not only protects workers but it also protects the public by ensuring workers are not coming to work sick.6
Share of workers across the South with access to paid sick leave, 2021
| Region | Share of workers with access to paid sick leave | Region | Share of workers with access to paid sick leave |
|---|---|---|---|
| Florida | 65.1% | Kentucky | 67.9% |
| Oklahoma | 66.4% | Georgia | 67.9% |
| Tennessee | 67.1% | West Virgina | 68.2% |
| Louisiana | 67.2% | Alabama | 68.2% |
| Arkansas | 67.3% | Delaware | 69.8% |
| South Carolina | 67.3% | Virginia | 70.9% |
| Texas | 67.4% | Maryland | 90.8% |
| North Carolina | 67.7% | District of Columbia | 94.0% |
| Mississippi | 67.8% | ||
| United States | 77.8% |
Source: EPI compilation of data from Mehta and Milli 2023.
As of January 1, 2024, 15 states and the District of Columbia have passed paid sick leave laws (KFF 2023). Three states—Illinois, Maine, and Nevada—have more general paid leave laws that workers can use to take time off for illness or injury, but they are not limited to using them for these purposes (Illinois DOL n.d.; Williamson 2023). Across all these states, only Maryland and the District of Columbia are in the South.7 Table 1 shows data from one study of access to paid sick leave for states across the South.
The authors found that in all but three states that had a state paid sick leave law, more than 90% of workers had access to paid sick days. In contrast, in states that did not have a state paid sick leave law, access levels ranged from as low as 64.6% to 75.9%, with most state rates below 70%. Seven of the 10 states with the least access—Florida (34.9%), Oklahoma (33.6%), Tennessee (32.9%), Louisiana (32.8%), Arkansas (32.7%), South Carolina (32.7%), and Texas (32.6%)—were in the South (Mehta and Milli 2023). This amounts to millions of workers in states like Florida (3.4 million), Tennessee (1.1 million), and Texas (4.4 million) lacking access to a basic benefit (Mehta and Milli 2023).
In contrast to most Southern states, more than 90% of workers in the District of Columbia (94%) and Maryland (90.8%) had access to paid sick leave—they both have paid sick leave laws.
Paid family and medical leave
In addition to needing time off when they are sick, workers also often need extended time off to care for and bond with a new baby or when they or someone in their family have more serious medical needs. Good jobs ensure that workers can take the time they need. Unfortunately, the U.S. does not have a federal guarantee of paid family and medical leave for workers. What the U.S. does have is the Family and Medical Leave Act (FMLA), which provides unpaid, job-protected leave to “eligible” workers to care for a newborn or newly adopted child; a sick or injured child, spouse, or parent; or their own serious health issue. Unpaid, job-protected leave is also provided to family members of a spouse, parent, or child that is on “covered active duty” (DOL 2023).
The FMLA, signed into law in 1993, provides 12 weeks of leave in any 12-month period or 26 weeks for a spouse, child, parent, or next of kin caring for an injured servicemember (Gould 2019; Shabo 2024a).8 While this law is important, it has serious shortcomings. First, it is unpaid, which puts many low-wage workers in economic peril if they must take leave. If they simply cannot afford the lost income, they will not be able to properly care for themselves or their families.
The FMLA also excludes large swathes of workers; it just covers 56% of workers (Brown, Herr, Roy, and Klerman 2020; Gould 2019; Shabo 2024a). Workers can be found to be ineligible for FMLA coverage because they haven’t worked for the employer for at least 12 months; because they didn’t work 1,250 hours in the last 12 months for their current employer; or because they work at a location where the employer does not have at least 50 employees within 75 miles of the workplace (Brown, Herr, Roy, and Klerman 2020; DOL 2023). These exclusions create inequities in whose jobs are protect along the lines of income, race, ethnicity, and education (Brown, Herr, Roy, and Klerman 2020).
Increasingly, however, some states are stepping in to address some of the inadequacies of the FMLA. Nine states—California, Colorado, Connecticut, Massachusetts, New Jersey, New York, Oregon, Rhode Island, and Washington—and the District of Columbia currently provide workers with state paid family leave benefits (Shabo 2024a; Shabo 2024b). Of these, only the District of Columbia is in the South. An additional four states—Maryland, Delaware, Maine, and Minnesota—have enacted state paid family and medical leave laws that will provide benefits starting in 2026 (Shabo 2024b). Just two of these are in the South, and none of the Southern states with leave adopt the Southern economic development model.
Most state plans take a progressive approach, which replaces a larger share of low-wage worker’s wages than they do of high earner’s wages. For example, in California, low-wage workers will receive 90% of their typical earnings beginning in 2025 (Shabo 2024b). Today it is a 70% wage replacement rate for low-wage workers and 60% for other workers. This is not limited to California, however. Only Massachusetts (80%) and New Jersey (85%) have a wage replacement rate below 90% (Shabo 2024b).
Most state paid family and medical leave programs are also funded in a sustainable way with a small tax paid by the employer, employee, or a combination of both. This money goes into a public fund, which pays out the benefit to workers (Shabo 2024b; Williamson 2023). State paid family leave policies also embrace a broader definition of family that tends to include domestic partners (Shabo 2024b).
As noted, only three Southern states—Delaware, D.C., and Maryland—have or will have a state paid family and medical leave program by 2026. Six Southern states have taken a very different approach to providing paid family leave. Alabama (2023), Arkansas (2023), Florida (2023), Tennessee (2023), Texas (2023), and Virginia (2022) have adopted private insurance models of paid leave that allow private insurance companies to sell insurance policies to employers and/or to workers themselves to provide benefits while they are on leave (Shabo 2024b; Widiss 2023).9
This approach has been embraced by the insurance industry. The National Conference of Insurance Legislators adopted a paid family leave model law at their 2022 annual meeting. A press release touts the model law as providing “a framework for states to create a new line of insurance in which any insurer licensed to transact life insurance or disability income insurance will also be able to provide coverage for paid family leave” (Insurance News Net 2022).
Because these models have been enacted so recently, there is not much data on what they look like or how they will perform. Despite this, Shabo (2024b) found that the estimated costs in New Hampshire of using a similar model was overall more expensive than state paid family leave programs. Widiss (2023) highlights that this approach resembles the short-term disability model, a benefit that just 40% of all workers in the United States and 22% of low-wage workers in the country receive from their employers. Across the South, just 32% of workers receive this benefit (Widiss 2023). Further, Widiss points to the short-term disability policies replacing just 50%–60% of workers’ regular wages, a much lower replacement rate than state paid leave plans. The private insurance models for paid leave will therefore almost certainly provide less coverage, cover fewer workers, increase already large disparities in access, and will likely be more expensive (Widiss 2023).
Being able to take time off work for the birth of a new child, to provide care for a sick parent, or to support a disabled spouse without fearing job loss is crucial for all families. Knowing that you and your family will be protected from having an economic emergency on top of a physical illness or injury is just one of the most basic rights that all workers should have access to—independent of their race, education, income, region, or size of employer.
Southern state lawmakers have also disempowered local communities
Unionization rates are a key predictor of job quality and the overall economic well-being of Southerners
Finally, we examine union coverage rates across the South. A key component of the Southern economic development model is a zealous opposition to unionization or collective bargaining. The model’s proponents have sought to ensure as much as possible that workers are not empowered, which allows them to advertise their states as “business friendly.” Business friendly, in their minds, means low wages and few (if any) benefits for workers, and low taxes and few regulations for businesses.
When workers are able to join together in a union, they are empowered to improve their own economic status, even when politicians refuse to raise their state minimum wage or to ensure access to pensions or paid leave. Research has repeatedly shown that higher rates of unionization and union coverage are associated with higher wages; increased access to employer-provided health care, paid sick leave, and paid family and medical leave; smaller wage gaps by race and sex; better working conditions; and lower economic inequality, among other benefits (Banerjee et al. 2021; Freeman, Han, Madland, and Duke 2015; Frymer and Grumbach 2020; Mishel 2021; Mishel, Rhinehart, and Windham 2020).
Figure H shows union coverage rates by region. Union coverage rates are much lower across the South than in other regions of the country. While union coverage rates have generally declined across regions, rates across the South in 2021 (6%) are less than half that of the Midwest (12.6%), the region with the next-lowest rate. They are highest in the Northeast (17.9%) and the West (15%), regions that have higher median wages and a smaller share of workers being paid less than $15 per hour. States in the Northeast and West are also more likely to have paid sick leave laws and state paid family and medical leave programs. Union coverage rates across states are a clear indicator of job quality and of worker-friendly state-level policies.
The South lags behind in union coverage rates: Union coverage rates by region, 1989–2021
| Year | South | West | Northeast | Midwest |
|---|---|---|---|---|
| 1989 | 11.2% | 20.1% | 24.3% | 22.0% |
| 1990 | 10.7% | 19.5% | 24.8% | 21.6% |
| 1991 | 10.9% | 19.3% | 25.0% | 21.2% |
| 1992 | 10.8% | 19.4% | 23.6% | 21.0% |
| 1993 | 10.9% | 19.0% | 23.7% | 20.7% |
| 1994 | 10.7% | 19.1% | 24.0% | 20.2% |
| 1995 | 9.8% | 18.4% | 23.4% | 19.7% |
| 1996 | 9.7% | 17.2% | 22.2% | 19.7% |
| 1997 | 9.0% | 17.0% | 21.7% | 19.0% |
| 1998 | 8.9% | 16.6% | 21.4% | 18.6% |
| 1999 | 8.9% | 16.8% | 21.4% | 18.3% |
| 2000 | 8.6% | 15.9% | 20.9% | 18.0% |
| 2001 | 8.6% | 15.8% | 21.0% | 17.8% |
| 2002 | 8.3% | 16.2% | 20.3% | 17.3% |
| 2003 | 8.2% | 16.0% | 19.9% | 17.0% |
| 2004 | 7.6% | 15.6% | 20.0% | 16.4% |
| 2005 | 7.3% | 15.6% | 20.3% | 16.1% |
| 2006 | 7.0% | 15.2% | 19.5% | 15.5% |
| 2007 | 7.1% | 15.9% | 19.9% | 15.0% |
| 2008 | 7.2% | 17.0% | 20.2% | 15.5% |
| 2009 | 7.2% | 16.1% | 20.8% | 15.2% |
| 2010 | 7.1% | 16.1% | 19.5% | 14.4% |
| 2011 | 7.0% | 15.7% | 19.4% | 14.7% |
| 2012 | 7.1% | 15.6% | 18.5% | 13.2% |
| 2013 | 7.2% | 14.9% | 18.4% | 13.5% |
| 2014 | 6.8% | 15.0% | 18.5% | 13.3% |
| 2015 | 7.1% | 14.7% | 18.7% | 13.1% |
| 2016 | 6.6% | 14.8% | 18.0% | 12.9% |
| 2017 | 6.5% | 14.6% | 18.3% | 12.8% |
| 2018 | 6.5% | 14.3% | 17.9% | 12.5% |
| 2019 | 6.4% | 14.6% | 17.2% | 12.4% |
| 2020 | 6.9% | 14.8% | 18.1% | 13.1% |
| 2021 | 6.0% | 15.0% | 17.9% | 12.6% |
| 2022 | 6.0% | 14.7% | 16.9% | 12.2% |
Note: Union coverage refers to union members and those who are not members but are still covered by a union contract.
Source: EPI analysis of Current Population Survey Outgoing Rotation Group microdata.
Figure I shows union coverage rates for individual states across the South in 2019 and 2023. As with the indicators above, in 2019 before the pandemic, Maryland (12.7%), Delaware (9.9%), and D.C. (10.2%) fared better than most Southern states in terms of having a larger share of their workers covered by a union. West Virginia (11.1%), however, has the second-highest union coverage rate. The lowest union coverage states are South Carolina (2.7%), North Carolina (3.4%), and Georgia (5%), with Virginia and Texas tied at 5.2%—compared with a national rate of 11.2% in 2023 (BLS 2024).
Low union coverage rates fell further in half of Southern states following the pandemic: Union coverage rates by state, 2019 and 2023
| 2019 | 2023 | |
|---|---|---|
| South Carolina | 2.7% | 3.0% |
| North Carolina | 3.4% | 3.3% |
| Georgia | 5.0% | 5.4% |
| Texas | 5.2% | 5.4% |
| Virginia | 5.2% | 5.6% |
| Tennessee | 5.5% | 6.9% |
| Arkansas | 5.9% | 5.8% |
| Louisiana | 6.0% | 5.1% |
| Florida | 7.5% | 6.1% |
| Oklahoma | 7.9% | 7.8% |
| Mississippi | 8.4% | 9.8% |
| Kentucky | 9.4% | 11.2% |
| Alabama | 9.8% | 8.6% |
| Delaware | 9.9% | 10.1% |
| District of Columbia | 10.2% | 10.4% |
| West Virginia | 11.1% | 10.1% |
| Maryland | 12.7% | 12.8% |
Source: EPI analysis of Bureau of Labor Statistics Current Population Survey microdata.
Half of states across the South (seven of the 14 shown in Figure I) experienced a decline in union coverage following the pandemic. The largest declines were in Florida (-1.4 percentage points), Alabama (-1.2), and West Virginia (-1). These declines are not because workers do not favor unions; we have seen increased demands for unions from public school teachers and workers at Starbucks, Amazon, Google, Trader Joe’s, and many other private companies across the nation (De Vynck and Gurley 2022; Durbin 2023; Hsu 2022; Greenhouse 2023; Ingram 2023; Scheiber 2023). In fact, in the first half of 2022 alone, unions won 662 elections (Chernikoff 2023). In the first eight months of 2023, 323,000 workers walked off the job to demand improvements in pay, benefits, or working conditions (Chernikoff 2023). While nationally there has been little change in union coverage rates, there has been an increase in absolute numbers of workers joining unions (Shierholz, McNicholas, Poydock, and Sherer 2024). Notably, Figure I shows that since 2019, there were small increases in union coverage rates in several Southern states, with the largest increases in Kentucky (1.8 percentage points), Tennessee (1.4), and Mississippi (1.4).
Across the South, most states have passed so-called right-to-work laws, with the exceptions of Delaware, Maryland, and the District of Columbia. Right-to-work laws do not, in any way, guarantee workers will have access to a job if they want one. They simply make it harder for unions to be financially sustainable. Unions are legally required to protect and advocate on behalf of all workers at a company, not just union members. Because contract negotiations and legally representing workers—whether they are union members or not—can be expensive, in some states, private-sector unions can charge nonmembers a small agency fee to cover the costs of negotiating for them. In right-to-work states, unions are not allowed to collect this fee, effectively starving unions of resources (NCSL 2023).
And it is not only through right-to-work laws that politicians across the South and beyond oppose unions. Senator Mike Hodges introduced Senate Bill 362 in Georgia, a bill that would bar new businesses in Georgia from receiving state incentives if they voluntarily recognized a union based on a card check rather than a more costly election (R. Williams 2024; D. Williams 2024). Card checks are among the traditional and legal ways unions are recognized; when a majority of workers agree to sign authorization cards, they recognize the union as their bargaining representative (Eisenbrey 2009; 2012). Senator Jack Johnson sponsored a similar bill in Tennessee (Johnson 2023). Essentially, these bills attempt to penalize employers who want to respect workers’ right to join with their coworkers to collectively bargain for fair wages, good benefits, and safe working conditions.
Efforts to organize workers across the South have seen real pushback from governors—from Kay Ivey in Alabama referring to efforts to organize workers as an “attack” to Governor Kemp in Georgia putting his full support behind Senator Hodges’s bill and Governor McMaster of South Carolina vowing to “fight [unions] all the way to the gates of hell” to defeat “pro-union policies” in his state (Harris 2024; Ivey 2024; Kemp 2024).
In addition to right-to-work laws and the overall opposition from political leaders across the region, workers seeking to organize a union typically face intense opposition from employers. Companies spend $340 million dollars per year on consultants to help them prevent unionization among workers, and one in five unionization campaigns results in a charge that a worker was fired for trying to unionize (McNicholas et al. 2019). Further, because of the political opposition to unions, when workers try to organize, employers know that they can illegally intimidate them, refuse to recognize the union, or negotiate a contract in bad faith—with little to no fear of being held accountable by political leaders.
The fierceness of the opposition to unions, however, is perhaps one of the best indicators of the power of workers joining together to demand fair pay and fair treatment.
Preemption prevents local lawmakers from improving economic conditions for their constituents
In this report, we examined the evidence on job quality across the South and across the states within the South. We showed that workers in Southern states have worse job quality and are less likely to experience true economic security. While political leaders in many states across the South oppose policies that would empower workers, within these states, there are city and county officials who support higher minimum wages and access to pensions and paid leave for workers. A primary reason that many local jurisdictions across the South do not have these policies that support and empower workers in place is state-level preemption. Preemption is when state policymakers either block a local ordinance or dismantle an existing ordinance. States across the South with majority-white state legislatures have used preemption laws more than policymakers in states outside the South. They use preemption to block ordinances that would increase the economic security of people in localities where a majority of residents are people of color (Blair, Cooper, Wolfe, and Worker 2020).
Figure J shows a map of U.S. states and the number of policies that have been preempted at the state level. Across the South, local jurisdictions have been preempted from raising the minimum wage, providing paid leave, ensuring workers are given fair work schedules, or requiring contractors to pay workers the prevailing wage. Localities are not allowed to require project labor agreements, contracts that are unique to the construction industry and negotiated between labor unions and contractors laying out the terms and conditions of employment for construction projects. They also preempt the regulation of gig economy work, such as driving for Uber or Lyft. These laws often prevent regulation that would treat these workers as employees and entitle them to all the accompanying rights and protections. Instead, localities require they be treated as independent contractors who are not entitled to the same protections.
Southern states are the most likely to utilize preemption to disempower workers: Map of labor standards preemption by state
| State | Preempts minimum wage | Preempts fair scheduling | Preempts project labor agreements | Preempts prevailing wage | Preempts paid leave | Preempts gig economy | Number |
|---|---|---|---|---|---|---|---|
| Alabama | Yes | Yes | Yes | No | Yes | Yes | 5 |
| Alaska | No | No | No | No | No | Yes | 1 |
| Arizona | Yes | Yes | Yes | Yes | Yes | Yes | 6 |
| Arkansas | Yes | Yes | Yes | No | Yes | Yes | 5 |
| California | No | No | No | No | No | Yes | 1 |
| Colorado | Yes | No | No | No | No | Yes | 2 |
| Connecticut | No | No | No | No | No | No | 0 |
| Delaware | No | No | No | No | No | Yes | 1 |
| Washington D.C. | No | No | No | No | No | No | 0 |
| Florida | Yes | No | Yes | Yes | Yes | Yes | 5 |
| Georgia | Yes | Yes | Yes | Yes | Yes | Yes | 6 |
| Hawaii | No | No | No | No | No | Yes | 1 |
| Idaho | Yes | No | Yes | Yes | No | Yes | 4 |
| Illinois | No | No | No | No | No | No | 0 |
| Indiana | Yes | Yes | No | Yes | Yes | Yes | 5 |
| Iowa | Yes | Yes | Yes | No | Yes | Yes | 5 |
| Kansas | Yes | Yes | Yes | Yes | Yes | No | 5 |
| Kentucky | Yes | No | No | Yes | Yes | Yes | 4 |
| Louisiana | Yes | No | Yes | Yes | Yes | Yes | 5 |
| Maine | No | No | Yes | No | No | Yes | 2 |
| Maryland | No | No | Yes | No | No | Yes | 2 |
| Massachusetts | No | No | No | No | No | Yes | 1 |
| Michigan | Yes | Yes | Yes | Yes | Yes | Yes | 6 |
| Minnesota | No | No | No | No | No | No | 0 |
| Mississippi | Yes | No | Yes | No | Yes | Yes | 4 |
| Missouri | Yes | No | Yes | No | Yes | Yes | 4 |
| Montana | No | No | Yes | No | No | Yes | 2 |
| Nebraska | No | No | No | No | No | No | 0 |
| Nevada | No | No | Yes | No | No | Yes | 2 |
| New Hampshire | No | No | No | No | No | Yes | 1 |
| New Jersey | No | No | Yes | No | No | Yes | 2 |
| New Mexico | No | No | No | No | No | Yes | 1 |
| New York | No | No | No | No | No | Yes | 1 |
| North Carolina | Yes | No | Yes | No | Yes | Yes | 4 |
| North Dakota | Yes | No | Yes | Yes | No | Yes | 4 |
| Ohio | Yes | Yes | No | No | Yes | Yes | 4 |
| Oklahoma | Yes | No | Yes | No | Yes | Yes | 4 |
| Oregon | Yes | No | Yes | No | No | No | 2 |
| Pennsylvania | Yes | No | No | No | No | Yes | 2 |
| Rhode Island | Yes | No | Yes | No | No | Yes | 3 |
| South Carolina | Yes | No | Yes | No | Yes | Yes | 4 |
| South Dakota | No | Yes | No | No | Yes | 2 | |
| Tennessee | Yes | Yes | Yes | Yes | Yes | Yes | 6 |
| Texas | Yes | No | No | No | No | Yes | 2 |
| Utah | Yes | No | Yes | Yes | No | Yes | 4 |
| Vermont | No | No | No | No | No | No | 0 |
| Virginia | No | No | No | No | No | Yes | 1 |
| Washington | No | No | No | No | No | No | 0 |
| West Virginia | No | No | Yes | No | No | Yes | 2 |
| Wisconsin | Yes | Yes | Yes | Yes | Yes | Yes | 6 |
| Wyoming | No | No | No | No | No | Yes | 1 |
Source: EPI analysis of preemption laws in all 50 states.
While the Southern economic development model emerged out of efforts of powerful interests—including politicians, plantation owners, and other employers—to continue extracting undervalued labor from Black men and women following the Civil War, the use of preemption across the South is a continuation of that process. All the data presented in Figure J show the efforts of state officials across the South to ensure wages are low and workers are economically insecure, and to ignore the needs of workers to care for their families. The harms caused by these policies are not limited to Black and brown Southerners; they hurt all workers and families across the region, although the greatest negative impacts continue to be on Black and brown Southerners.
Conclusion
To begin to work toward changing the Southern economic development model, it will be important for Southerners from all backgrounds—across race, ethnicity, gender, immigrant statuses, and income levels—to stand together and build the coalitions needed to demand policymakers create a new economic development model. Workers and families across the South deserve an economic model that centers and empowers workers and families, providing all workers with the wages and benefits that would ensure their economic security and allow them to sustain their families. This includes:
- raising the minimum wage to a living wage
- ensuring all workers have health insurance
- providing workers with a pension
- giving all workers access to paid leave, including paid sick days and paid family and medical leave
Finally, and perhaps most important, workers must be able to come together in a union to demand fair wages and benefits, a safe working environment, and the ability to have a say about their workplace—even when politicians are intransigent. This is a model that would serve the interests of all Southerners.
Notes
1. In this report, we use the U.S. Census Bureau’s definition of the South Census Region, which includes: Alabama, Arkansas, Delaware, Florida, Georgia, Kentucky, Louisiana, Maryland, Mississippi, North Carolina, Oklahoma, South Carolina, Tennessee, Texas, Virginia, West Virginia, and the District of Columbia. We note when analyses focus on a subset of these states.
2. For the median hourly wage for all states ranked from highest to lowest, see Appendix Table 1.
3. There are exceptions that allow some workers to be paid less than the $7.25 federal minimum wage. Some groups covered by these exceptions include tipped workers, workers with disabilities, some youth workers, and seasonal or agricultural workers. However, when a state law requires a higher minimum wage than federal law, the state law would apply (U.S. Department of Labor n.d.).
4. Data for the District of Columbia is not included in the ranking of states here because it is a city-state and the seat of the federal government, which artificially raises wages. If D.C. had been included, it would have been among the 10 highest-earning states.
5. The third state is California.
6. Typically, paid sick leave laws are structured so that workers earn time off based on how much they work. For example, a worker may earn one hour of paid sick leave for every 30 hours they work, up to a maximum number of earned hours (Mehta and Milli 2023).
7. States that have paid sick leave laws are: Arizona, California, Colorado, Connecticut, the District of Columbia, Maryland, Massachusetts, Minnesota, New Jersey, New Mexico, New York, Oregon, Rhode Island, Vermont, and Washington (National Partnership 2023). Some cities and counties have also passed paid sick leave laws, but only one—Montgomery County, Maryland—is in the South. This reflects the fact that state lawmakers across the South have used preemption to block city and county laws that would protect workers but that state lawmakers oppose (EPI 2024).
8. Military Caregiving Leave was not part of the original FMLA, but the FMLA was amended to add these provisions.
9. New Hampshire also provides paid family and medical leave through an insurance program that is required for public employers but is voluntary for private employers, who may purchase a plan for their employees, share the costs with employees, or require employees to purchase the plan to participate (Landroche n.d.; Shabo 2024a).
References
Banerjee, Asha, Margaret Poydock, Celine McNicholas, Ihna Mangundayao, and Ali Sait. 2021. Unions Are Not Only Good for Workers, They’re Good for Communities and for Democracy. Economic Policy Institute, December 2021.
Blair, Hunter, David Cooper, Julia Wolfe, and Jaimie Worker. 2020. Preempting Progress: State Interference in Local Policymaking Prevents People of Color, Women, and Low-Income Workers from Making Ends Meet in the South. Economic Policy Institute, September 2020.
Brown, Scott, Jane Herr, Radha Roy, and Jacob Alex Klerman. 2020. Employee and Worksite Perspectives of the FMLA: Who Is Eligible? Abt Associates, July 2020.
Bureau of Economic Analysis (BEA). 2023. “Real Personal Income for States and Metropolitan Areas.” U.S. Department of Commerce.
Bureau of Labor Statistics (BLS). 2024. “Union Members–2023” (news release). January 23, 2024.
Caplan, Zoe, and Megan Rabe. 2023. The Older Population: 2020 (2020 Census Brief). U.S. Census Bureau, May 2023.
Census Bureau. 2024. American Community Survey (ACS), Table S2001.
Chernikoff, Sara. 2023. “Here’s Why the U.S. Labor Movement Is so Popular but Union Membership Is Dwindling.” USA Today, September 7, 2023.
Childers, Chandra. 2023. Rooted in Racism and Economic Exploitation: The Failed Southern Economic Development Model. Economic Policy Institute, October 2023.
Childers, Chandra. 2024a. The Evolution of the Southern Economic Development Strategy. Economic Policy Institute, May 2024.
Childers, Chandra. 2024b. Breaking Down the South’s Economic Underperformance. Economic Policy Institute, June 2024.
Cooper, David, Sebastian Martinez Hickey, and Ben Zipperer. 2022. “The Value of the Federal Minimum Wage Is at Its Lowest Point in 66 Years.” Working Economics Blog (Economic Policy Institute), July 14, 2022.
Danney, Micah. 2021. “New Study Paints Bleak Picture of Alabama’s Tradeoff of Tax Breaks for Jobs.” Alabama Political Reporter, March 10, 2021.
De Vynck, Gerrit, and Lauren Kaori Gurley. 2022. “4,000 Google Cafeteria Workers Quietly Unionized During the Pandemic.” Washington Post, September 5, 2022.
Department of Labor (DOL). 2023. “The Family and Medical Leave Act” (fact sheet #28). February 2023.
Department of Labor (DOL). n.d. “Questions and Answers About the Minimum Wage” (web page). Accessed April 29, 2024.
DeWitt, Larry. 1996. Research Note #1: Origins of the Three-Legged Stool Metaphor for Social Security. Social Security Administration, May 1996.
Durbin, Dee-Ann. 2023. “Third Trader Joe’s Store Votes to Unionize.” Associated Press News, January 27, 2023.
Economic Policy Institute. 2023. Current Population Survey Extracts, Version 1.0.40.
Economic Policy Institute (EPI). 2024a. Low Wage Workforce Tracker.
Economic Policy Institute (EPI). 2024b. Minimum Wage Tracker.
Economic Policy Institute (EPI). 2024c. State of Working X Data Library.
Economic Policy Institute (EPI). 2024d. Worker’s Rights Preemption in the U.S.: A Map of the Campaign to Suppress Workers’ Rights in the States. Economic Policy Institute.
Eisenbrey, Ross. 2009. No Coercion in Card Check (economic snapshot). Economic Policy Institute, August 18, 2009.
Eisenbrey, Ross. 2012. “Card Check Survives as Way to Choose a Union.” Working Economics Blog (Economic Policy Institute), September 7, 2012.
Florida Policy Institute (FPI). 2024. “Enforcing the Minimum Wage: Statewide Wage Theft Threatens the Gains of Amendment 2” (web page). Accessed March 15, 2024.
Freeman, Richard, Eunice Han, David Madland, and Brendan V. Duke. 2015. “How Does Declining Unionism Affect the American Middle Class and Intergenerational Mobility?” National Bureau of Economic Research Working Paper no. 21638, October 2015.
Frymer, Paul, and Jacob M. Grumbach. 2020. “Labor Unions and White Racial Politics.” American Journal of Political Science 65, no 1: 225–240.
Gould, Elise. 2019. “Zero Weeks Plus Ellen Bravo on the Importance of Paid Family and Medical Leave.” Working Economics Blog (Economic Policy Institute), May 17, 2019.
Gould, Elise, and Katherine deCourcy. 2023. Low-Wage Workers Have Seen Historically Fast Real Wage Growth in the Pandemic Business Cycle. Economic Policy Institute, March 2023.
Gould, Elise, and Hilary Wething. 2023. Paid Sick Leave Access Expands with Widespread State Action. Economic Policy Institute, November 2023.
Greenhouse, Steven. 2023. “Will Starbucks’ Union-Busting Stifle a Union Rebirth in the US?” Guardian, August 28, 2023.
Harris, Javon L. 2024. “McMaster Pushes Against Labor Unions in SC. What Other Issues Top His 2024 Agenda?” The State, January 25, 2024.
Hickey, Sebastian Martinez. 2023. “Twenty-Two States Will Increase Their Minimum Wages on January 1, Raising Pay for Nearly 10 Million Workers.” Working Economics Blog (Economic Policy Institute), December 21, 2023.
Hsu, Andrea. 2022. “Starbucks Workers Have Unionized at Record Speed; Many Fear Retaliation Now.” NPR, October 2, 2022.
Illinois Department of Labor (Illinois DOL). n.d. Paid Leave for All Workers Act. Illinois.gov.
Ingram, Paul. 2023. “Teachers at Tucson’s BASIS Charter School Overwhelmingly Vote to Form Union.” Arizona Mirror, April 13, 2023.
Insurance News Net. 2022. “Paid Family Leave Model Law One of Four Adopted by NCOIL” (press release). December 16, 2022.
Ivey, Kay. 2024. “Unions Want to Target One of Alabama’s Crown Jewel Industries, but I’m Standing Up for Alabamians and Protecting Our Jobs.” Made in Alabama, January 10, 2024.
Johnson, Jack. 2023. “Why the Secret Union Ballot Is the New Battle for Worker Freedom in Tennessee.” Tennessean, March 30, 2023.
Kaiser Family Foundation (KFF). 2023. “State Policies on Paid Family and Sick Leave,” State Health Facts [table], accessed April 29, 2024.
Keisler-Starkey, Katherine, Lisa N. Bunch, and Rachel A. Lindstrom. 2023. Health Insurance Coverage in the United States: 2022. U.S. Census Bureau, September 2023.
Kemp, Brian P., Office of the Governor (Kemp). 2024. “Gov. Kemp Lays Out Priorities for 2024 Session at Georgia Chamber’s Annual Eggs and Issues Legislative Event” (press release). January 10, 2024.
Landroche, Patrick. n.d. HR Report: Paid Family Leave in New Hampshire? A Look at the Granite State Paid Family Leave Plan. New Hampshire Municipal Association.
McNicholas, Celine, Margaret Poydock, Julia Wolfe, Ben Zipperer, Gordon Lafer, and Lola Loustaunau. 2019. Unlawful: U.S. Employers Are Charged with Violating Federal Law in 41.5% of All Union Election Campaigns. Economic Policy Institute, December 2019.
Mehta, Sapna, and Jessica Milli. 2023. Millions of Working People Still Don’t Have Access to a Single Paid Sick Day. Center on Law and Social Policy, May 2023.
Mishel, Lawrence. 2021. The Enormous Impact of Eroded Collective Bargaining on Wages. Economic Policy Institute, April 2021.
Mishel, Lawrence, Lynn Rhinehart, and Lane Windham. 2020. Explaining the Erosion of Private-Sector Unions. Economic Policy Institute, November 2020.
Morrissey, Monique. 2016. The State of American Retirement: How 401(k)s Have Failed Most American Workers. Economic Policy Institute, March 2016.
National Association of Plan Advisors (NAPA). 2017. “What’s the Most Common Match?” NAPA, January 3, 2017.
National Conference of State Legislatures (NCSL). 2023. “Right-to-Work Resources” (web page). Accessed March 15, 2024.
National Partnership for Women & Families (National Partnership). 2016. “Most Women in Fast Food Industry Cannot Earn Paid Sick Time, Have Gone to Work with ‘Troubling Symptoms,’ Survey Finds” (press release). November 22, 2016.
National Partnership for Women and Families (National Partnership). 2023. “Current Paid Sick Days Laws” (fact sheet). June 2023.
Scheiber, Noam. 2023. “Amazon Is Cracking Down on Union Organizing, Workers Say.” New York Times, December 8, 2023.
Shabo, Vicki. 2024a. “Paid and Unpaid Leave Policies in the United States ” (explainer). New America, January 2, 2024.
Shabo, Vicki. 2024b. “Paid Leave Benefits and Funding in the United States” (explainer). New America, January 2, 2024.
Shierholz, Heidi, Celine McNicholas, Margaret Poydock, and Jennifer Sherer. 2024. Workers Want Unions, But the Latest Data Point to Obstacles in Their Path. Economic Policy Institute, January 2024.
Widiss, Deborah A. 2023. “Privatizing Family Leave Policy: Assessing the New Opt-in Insurance Model.” Seton Hall Law Review, Indiana Legal Studies Research Paper no. 506.
Williams, Dave. 2024. “State Senate Republicans Pass Bill Dems Deride as ‘Union-Busting.’” Capitol Beat, February 8, 2024.
Williams, Ross. 2024. “Georgia Senate Panel Advances Bill Aimed at Making the State Even Less Hospitable to Union Workers.” Georgia Recorder, February 1, 2024.
Williamson, Molly Weston. 2023. “The State of Paid Sick Time in the U.S. in 2023” (fact sheet). Center for American Progress, January 2023.
Appendix
Workers in Southern states are paid less than those in other regions: Median hourly earnings by state, 2021
| State | Median hourly wage |
|---|---|
| District of Columbia | $38.46 |
| Massachusetts | $26.39 |
| Maryland | $26.24 |
| New Jersey | $25.40 |
| Washington | $24.84 |
| Connecticut | $24.76 |
| Colorado | $24.00 |
| Virginia | $23.91 |
| Alaska | $23.91 |
| Minnesota | $23.89 |
| Rhode Island | $23.12 |
| New Hampshire | $23.11 |
| California | $23.06 |
| New York | $23.06 |
| Oregon | $23.00 |
| Illinois | $22.97 |
| Vermont | $22.35 |
| Wisconsin | $21.55 |
| Pennsylvania | $21.49 |
| Hawaii | $21.23 |
| Michigan | $21.09 |
| Delaware | $20.89 |
| Arizona | $20.74 |
| North Dakota | $20.72 |
| Ohio | $20.17 |
| Maine | $20.13 |
| Kansas | $20.11 |
| Nebraska | $20.08 |
| Indiana | $20.03 |
| Texas | $20.01 |
| Wyoming | $20.01 |
| Utah | $19.98 |
| Georgia | $19.97 |
| Florida | $19.96 |
| Iowa | $19.92 |
| Missouri | $19.92 |
| South Dakota | $19.89 |
| Alabama | $19.88 |
| North Carolina | $19.61 |
| Montana | $19.48 |
| New Mexico | $19.40 |
| Kentucky | $19.32 |
| Tennessee | $19.28 |
| South Carolina | $19.25 |
| Arkansas | $19.23 |
| Idaho | $19.23 |
| Nevada | $19.19 |
| Louisiana | $19.16 |
| West Virginia | $19.07 |
| Oklahoma | $18.40 |
| Mississippi | $17.77 |
Source: EPI analysis of CPS ORG microdata.
Average family hours of work by state, 2019
| State | Average family hours of work |
|---|---|
| Alaska | 3,360 |
| Alabama | 3,319 |
| Arkansas | 3,345 |
| Arizona | 3,622 |
| California | 3,634 |
| Colorado | 3,580 |
| Connecticut | 3,698 |
| District of Columbia | 3,542 |
| Delaware | 3,642 |
| Florida | 3,514 |
| Georgia | 3,466 |
| Hawaii | 3,879 |
| Iowa | 3,630 |
| Idaho | 3,470 |
| Illinois | 3,651 |
| Indiana | 3,661 |
| Kansas | 3,722 |
| Kentucky | 3,385 |
| Louisiana | 3,212 |
| Massachusetts | 3,806 |
| Maryland | 3,844 |
| Maine | 3,503 |
| Michigan | 3,443 |
| Minnesota | 3,661 |
| Missouri | 3,465 |
| Mississippi | 3,229 |
| Montana | 3,346 |
| North Carolina | 3,380 |
| North Dakota | 3,602 |
| Nebraska | 3,763 |
| New Hampshire | 3,778 |
| New Jersey | 3,761 |
| New Mexico | 3,108 |
| Nevada | 3,500 |
| New York | 3,559 |
| Ohio | 3,396 |
| Oklahoma | 3,515 |
| Oregon | 3,425 |
| Pennsylvania | 3,518 |
| Rhode Island | 3,499 |
| South Carolina | 3,289 |
| South Dakota | 3,620 |
| Tennessee | 3,411 |
| Texas | 3,541 |
| Utah | 3,613 |
| Virginia | 3,621 |
| Vermont | 3,494 |
| Washington | 3,341 |
| Wisconsin | 3,446 |
| West Virginia | 3,300 |
| Wyoming | 3,411 |
Source: EPI analysis of CPS ASEC data.