Tax expenditures
Tax expenditures include the exemptions, deductions, and credits you take when you file your federal tax return. They also include the nonwage benefits that are untaxed, like employer-paid health insurance premiums and 401(k) contributions. So two people with the same income can pay very different tax rates depending on which tax expenditures they qualify for. Corporations benefit from tax expenditures, too.
Tax expenditures lower the revenue going to the federal treasury. Because they are often justified in the name of achieving specific social goals, tax expenditures can be thought of as a form of indirect spending: Instead of spending directly on groups or activities, the federal government gives up collecting some revenue in order to assist specific groups of people and encourage specific activities. Essentially Congress says, “You owe x, but the IRS will forget about it if you spend your money on y [child care, buying a home, building a factory, etc.].” Congress doesn’t have to pursue goals that way. It could instead say, “You owe x, and we’ll spend public money directly on helping you with child care and housing assistance or making productive investments.”
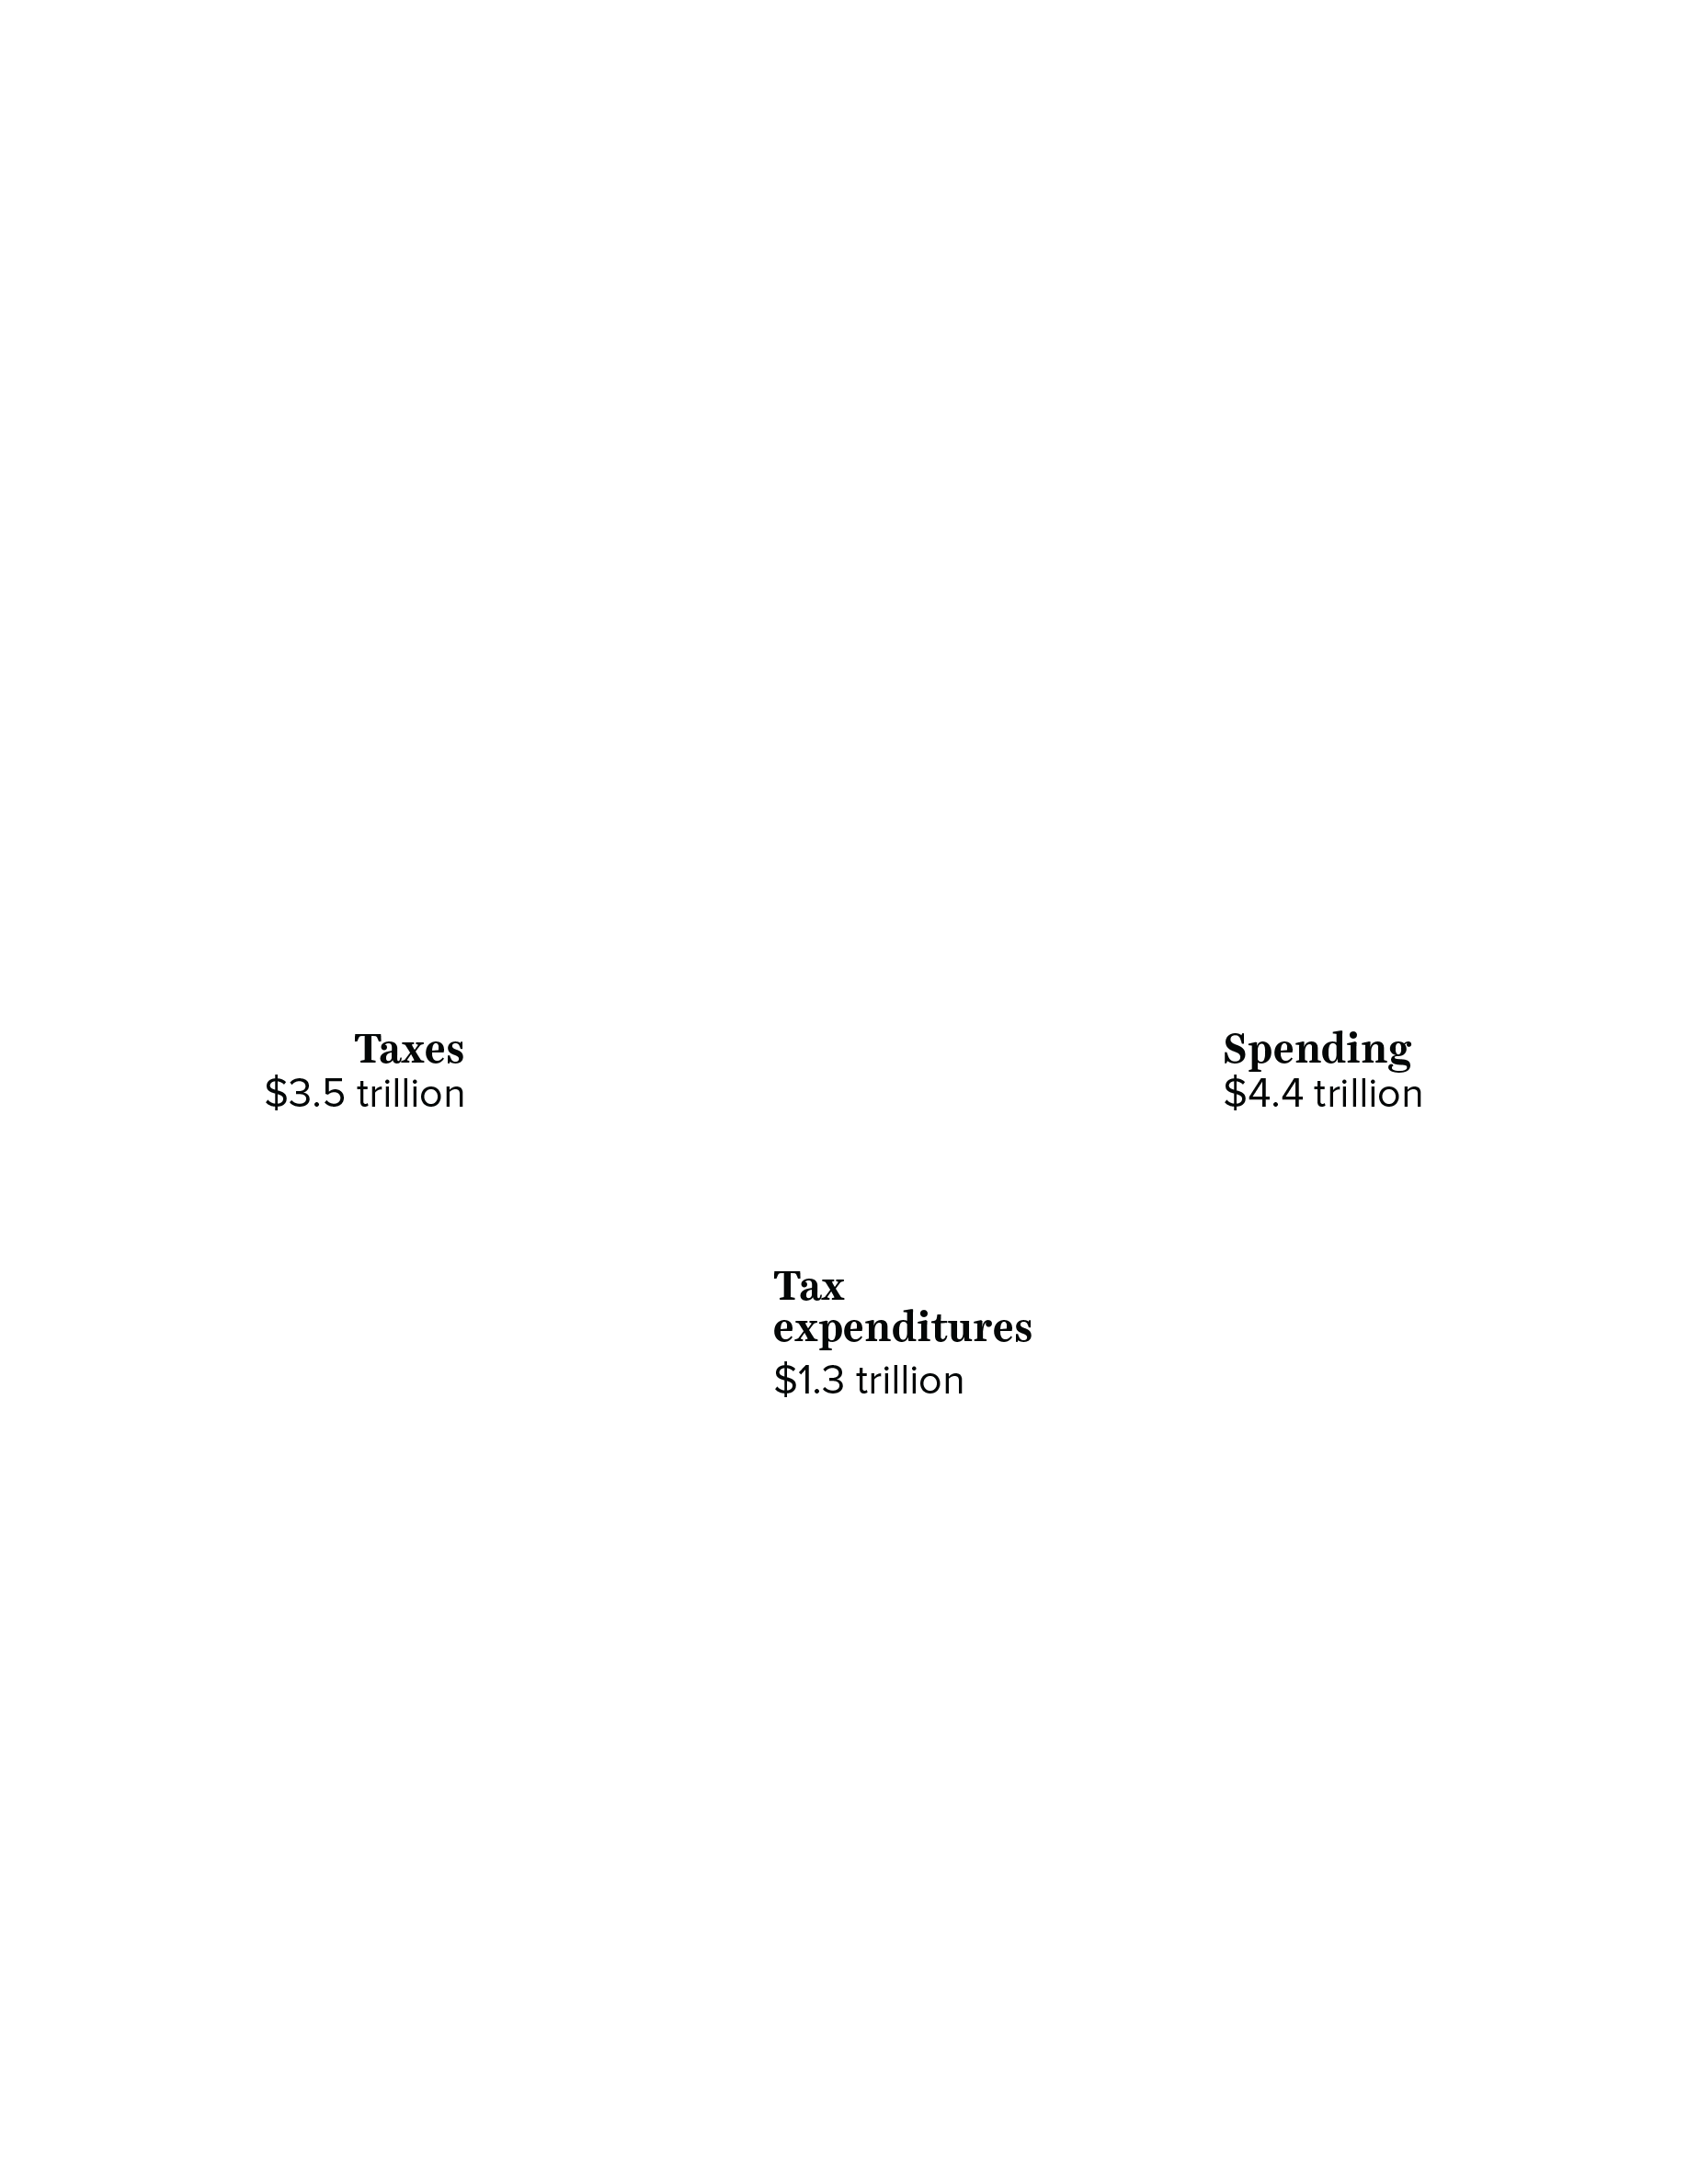
Without tax expenditures, the government could collect 44% more in taxes.
Source: CBO, The Federal Budget in 2019, an infographic; Government Accountability Office, “Figure: Tax Expenditures Are Comparable in Size to Discretionary Spending Levels,” Tax Expenditures (web page), 2019
Tax expenditures are a mostly hidden cost in the federal budget—but they are huge, and higher now than they were 20 years ago.
Tax expenditures are essentially subsidies that Congress delivers on autopilot through the tax code rather than debating when it votes on the nation’s budget. These subsidies total $1.5 trillion, over 7% of the U.S. economy. That means the federal government is spending about a third as much on tax expenditures as on total direct spending overall. Tax expenditures are so huge that they currently account for a larger share of the economy than discretionary spending—the part of the federal budget that Congress appropriates every year.
Tax expenditures as a percentage of GDP
| Fiscal year | Discretionary spending | Revenue lost from tax expenditures |
|---|---|---|
| 1987 | 9.3% | 7.9% |
| 1988 | 9.0% | 5.9% |
| 1989 | 8.8% | 6.0% |
| 1990 | 8.5% | 5.9% |
| 1991 | 8.8% | 5.8% |
| 1992 | 8.3% | 5.9% |
| 1993 | 8.0% | 5.8% |
| 1994 | 7.6% | 5.9% |
| 1995 | 7.2% | 5.9% |
| 1996 | 6.7% | 5.7% |
| 1997 | 6.5% | 5.7% |
| 1998 | 6.2% | 6.2% |
| 1999 | 6.0% | 6.4% |
| 2000 | 6.1% | 6.4% |
| 2001 | 6.2% | 6.8% |
| 2002 | 6.8% | 7.0% |
| 2003 | 7.3% | 6.5% |
| 2004 | 7.4% | 6.1% |
| 2005 | 7.5% | 6.0% |
| 2006 | 7.4% | 6.2% |
| 2007 | 7.3% | 5.9% |
| 2008 | 7.7% | 5.9% |
| 2009 | 8.6% | 6.8% |
| 2010 | 9.1% | 6.9% |
| 2011 | 8.7% | 6.9% |
| 2012 | 8.0% | 6.7% |
| 2013 | 7.2% | 6.9% |
| 2014 | 6.8% | 6.8% |
| 2015 | 6.5% | 6.8% |
| 2016 | 6.4% | 7.6% |
| 2017 | 6.2% | 7.6% |
| 2018 | 6.3% | 6.8% |
| 2019 | 6.3% | 6.2% |
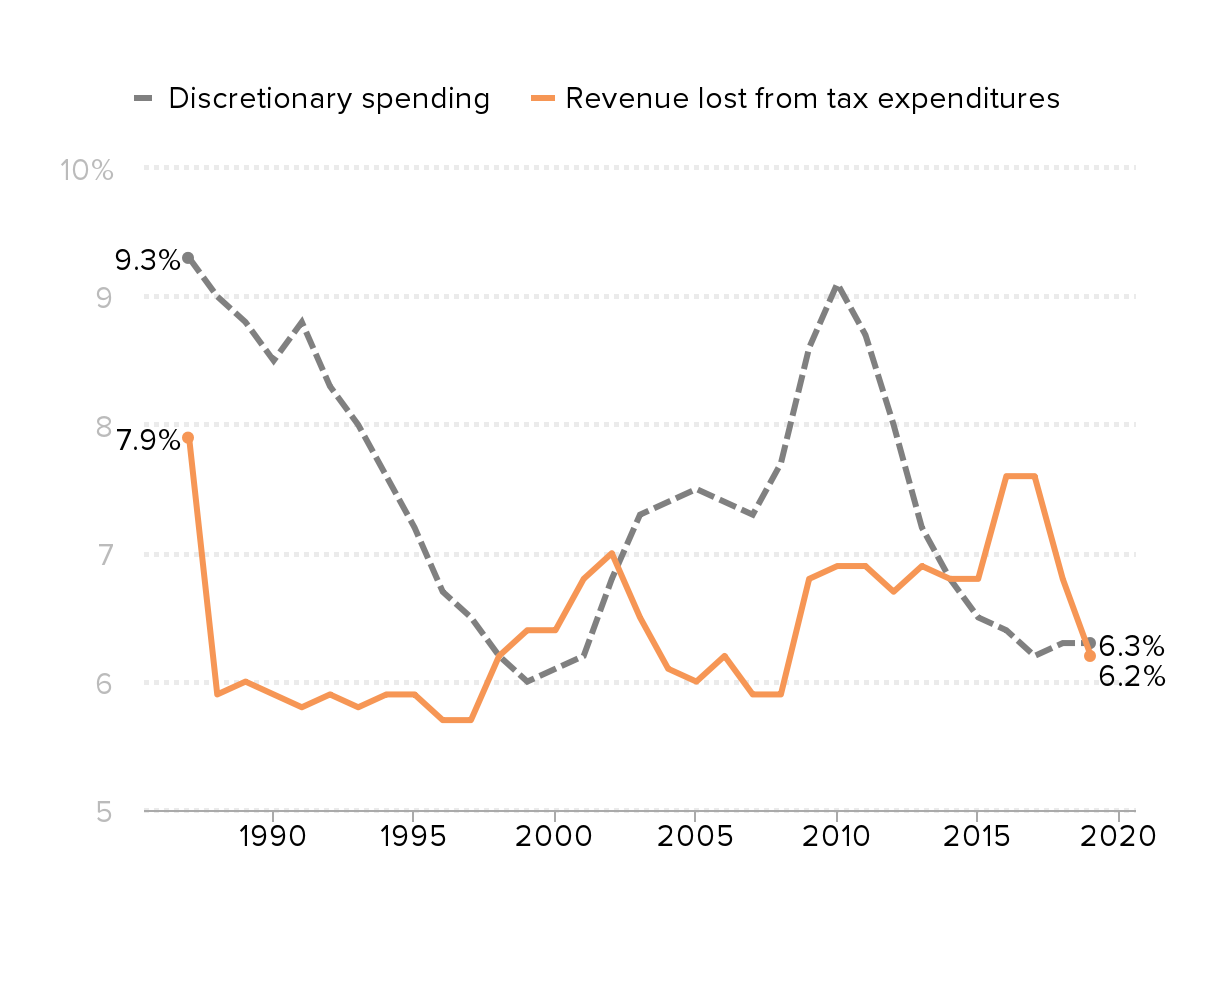
Government Accountability Office, “Figure: Tax Expenditures Are Comparable in Size to Discretionary Spending,” Tax Expenditures (web page), 2019. Data are for FY1987—FY2019.
Tax expenditures mostly benefit the top 20%.
In theory, these tax expenditures are put in the tax code by Congress to encourage individuals and corporations to work toward socially desirable goals—say, saving for retirement or investing in plants or equipment—or to benefit specific groups, such as working parents. In practice, except for refundable tax credits like the Earned Income Tax Credit (EITC) and Child Tax Credit (CTC), tax expenditures primarily benefit the top 20% of households. That’s why tax expenditures have often been referred to as “welfare for the upper middle class.”
There are the four main types of tax expenditures:
Tax exclusions
What are they? Tax exclusions are generally forms of income that are excluded from adjusted gross income (AGI) on your tax form. Because they never go into AGI, they reduce your taxable income.
Example: If you make contributions to an employer 401(k) plan or employer-provided health insurance, you can subtract those amounts from your earnings. And what your employer paid toward your retirement or health plan is never reported as part of your income in the first place.
How do exclusions affect my taxes? Because exclusions reduce your taxable income, the dollar benefit you get is proportional to the tax rate in your top tax bracket: how much in taxes you would have had to pay on that portion of income were it subject to taxation.
Who benefits? See the chart for how much of their after-tax income households at different income levels get from the exclusion of employer-provided health benefits.
Exclusion of employer-provided health insurance: Benefit as a percent of after-tax income
| Income bracket | Exclusion of employer-provided health insurance |
|---|---|
| Bottom 20% | 0.1% |
| 21–40th | 1 |
| Middle 20% | 1.7 |
| 61–80th | 1.7 |
| 81–90th | 1.8 |
| 91–95th | 1.6 |
| 96–99th | 1.3 |
| Top 1% | 0.4 |
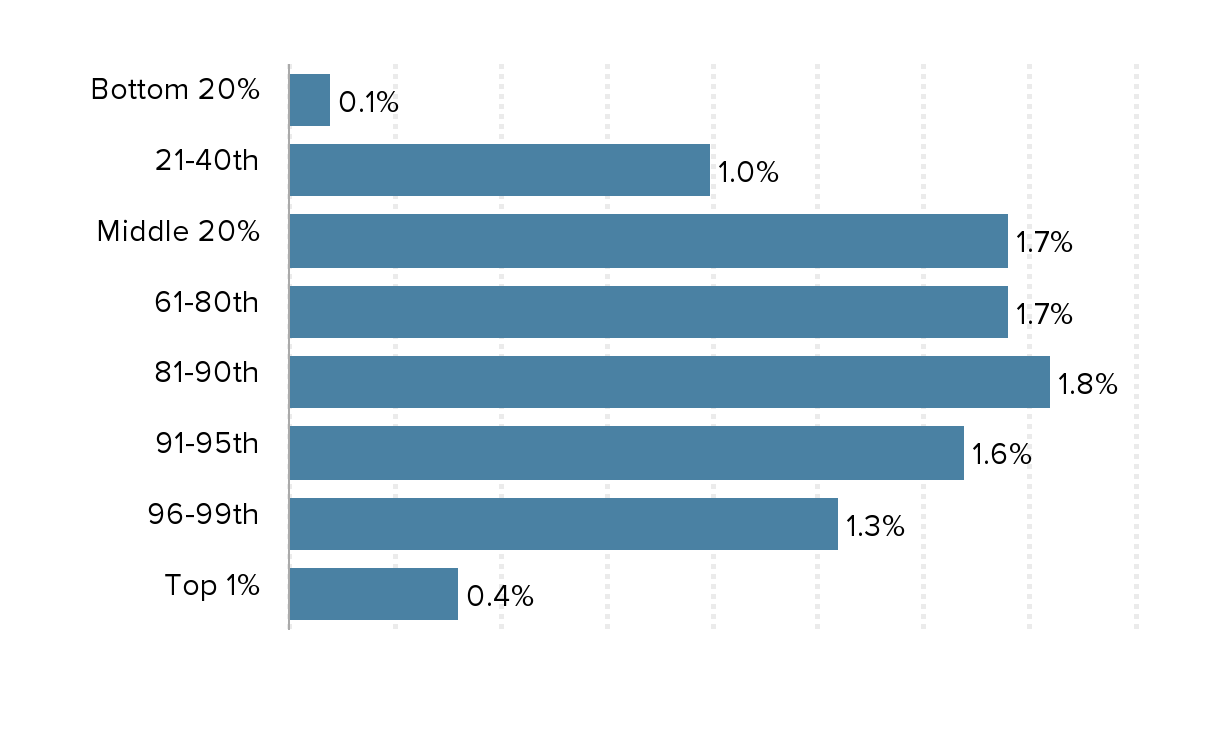
Tax Policy Center, Individual Income Tax Expenditures [online database], Table T18-0155, October 2018. Data are for 2018. The figure includes both employers’ contributions to health insurance for employees not counted as income for employees and employees’ contributions that are subtracted from their earnings when filing tax returns. As a share of income, benefits are low for the bottom 20% because a small share of these households have access to employer-based health insurance. Benefits are a small share of income for the top 1% because these households’ incomes are so large and there is only so much employer-provided health care these households need to consume.
Tax deductions
What are they? Itemized deductions are things you paid for that you can deduct to reduce your taxable income. Depending on the type of deduction, there may be a limit to the amount that can be deducted.
Example: Among the allowable deductions are expenses for running a business, donations to charity, real estate taxes, personal property taxes, state and local income or sales taxes, and home mortgage interest paid during the year.
How do they affect my taxes? Because deductions reduce your taxable income, the dollar benefit you get is proportional to the tax rate in your top tax bracket: how much in taxes you would have had to pay on that portion of income were it subject to taxation.
Who benefits? See the chart below for how much of their after-tax income households at different income levels get from being able to deduct mortgage interest they pay on their primary (and a second vacation) home.
Home mortgage interest deduction: Benefit as a percent of after-tax income
| Income bracket | Home mortgage interest deduction |
|---|---|
| Bottom 20% | 0% |
| 21–40th | 0 |
| 41–60th | 0.1 |
| 61–80th | 0.2 |
| 81–90th | 0.3 |
| 91–95th | 0.4 |
| 96–99th | 0.5 |
| Top 1% | 0.3 |
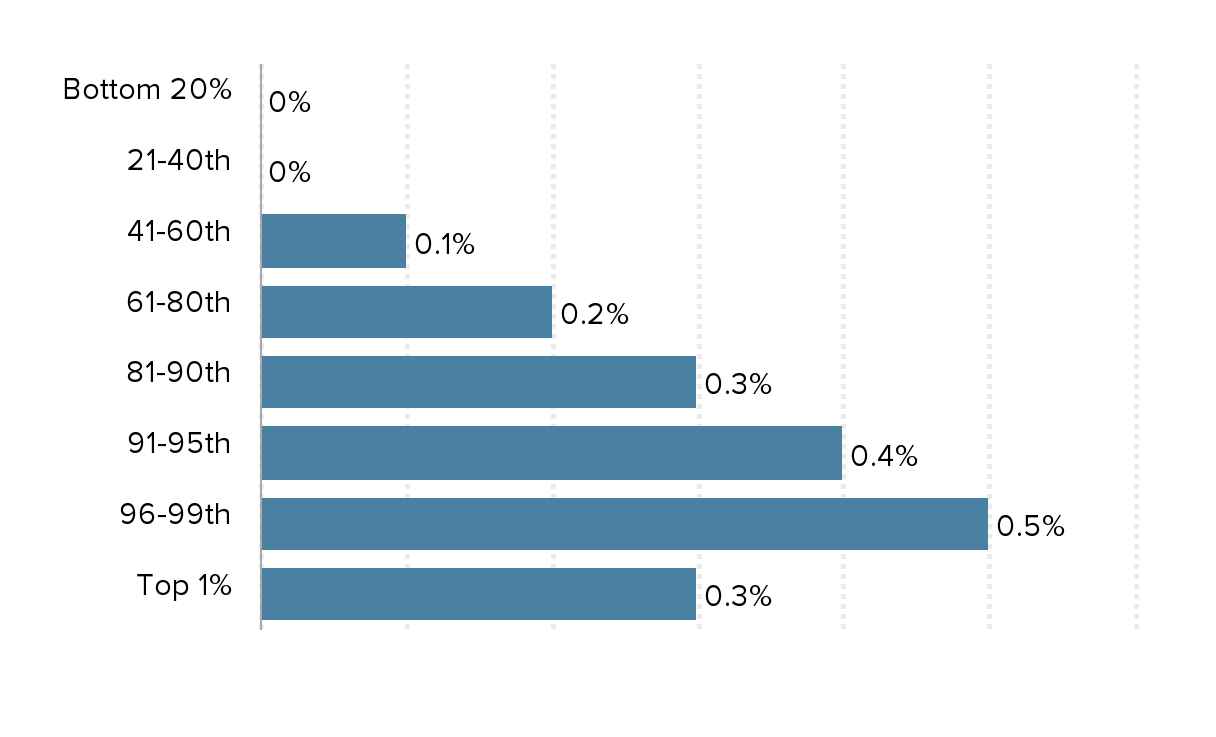
Tax Policy Center, Individual Income Tax Expenditures [online database], Table T18-0171, October 2018. Data are for 2018.
Tax credits
What are they? Tax credits are subtractions you can make from your final taxes owed tally if you meet certain criteria or have purchased certain services during your tax year. Some can trigger a tax refund.
Example: Examples of nonrefundable tax credits include the foreign tax credit and the retirement savings contribution credit. Examples of refundable tax credits include the Earned Income Tax Credit (EITC), for low-income working people, and the Premium Assistance Tax Credit for defraying the costs of premiums paid through the health insurance exchanges created by the Affordable Care Act. Some tax credits, like the child tax credit, are partially refundable.
How do they affect my taxes? Tax credits don’t reduce your taxable income. They offer a dollar-for-dollar reduction in your final tax bill—and in some cases give you a refund. After you tally the taxes you would owe based on your income, you apply your tax credits. Most tax credits are nonrefundable. They can be used only to reduce tax liability. So, if you owe $300 in taxes, you can claim a $500 tax credit and bring your tax bill to zero but you don’t get the remaining $200. Refundable tax credits are different. They take the amount left after reducing your tax bill to $0 and give it to you as a refund.
Who benefits? See the chart below for how much of their after-tax income households at different income levels get from being able to take the child tax credit—a $2,000 credit for each child under age 17 and a $500 credit for each child ages 17–18 or 19–24 and in college. Note that refundable tax credits like the EITC, the child tax credit, and the premium assistance tax credits from the Affordable Care Act are the only major tax expenditures whose benefits don’t accrue primarily to upper-middle-class and rich households.
Partially refundable child tax credit: Benefit as a percent of after-tax income
| Income bracket | Child tax credit |
|---|---|
| Bottom 20% | 1.3% |
| 21–40th | 1.9 |
| 41–60th | 1.6 |
| 61–80th | 1.2 |
| 81–90th | 0.9 |
| 91–95th | 0.6 |
| 96–99th | 0.3 |
| Top 1% | 0 |
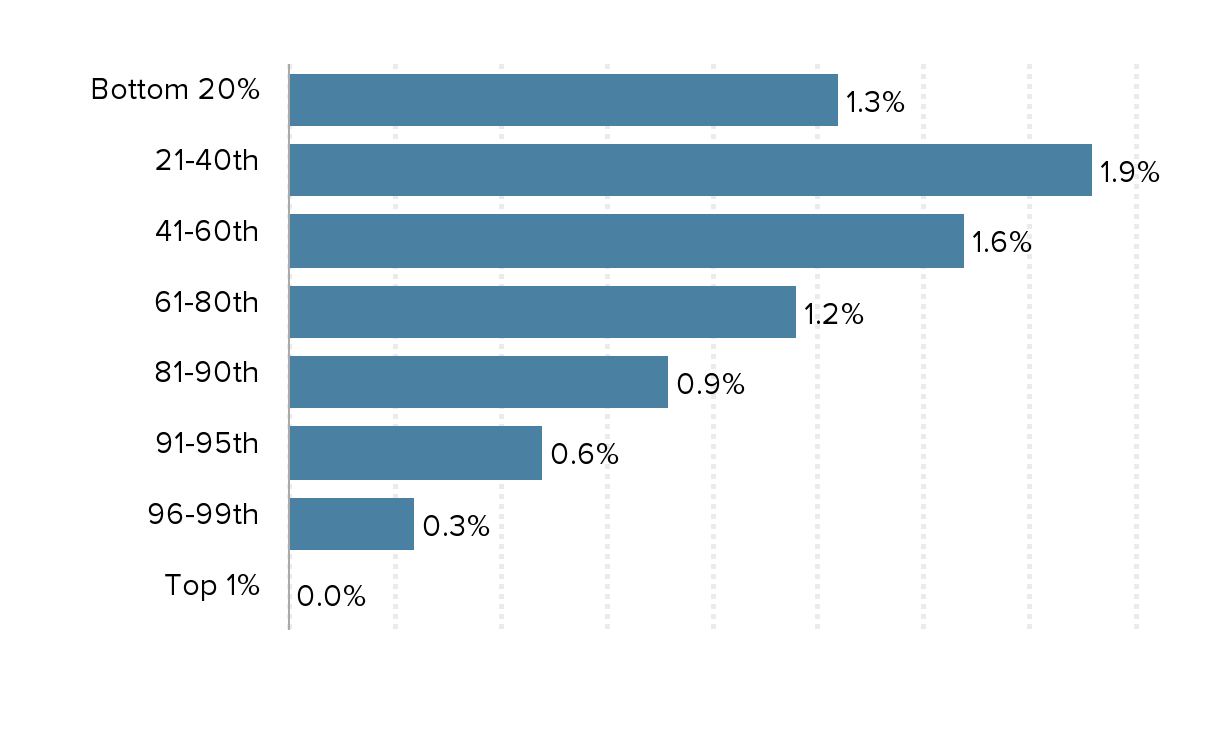
Tax Policy Center, Individual Income Tax Expenditures [online database], Table T18-0195, October 2018. Data are for 2018.
Tax preferences
What are they? Tax preferences are reduced tax rates on certain types of income.
Example: The preferential tax rate on capital gains.
How do they affect my taxes? If you make a big profit selling shares of stock, a piece of art, a parcel of land, or a company, you pay a much lower tax than the tax you pay on your wages or commissions or interest on bonds. The preferential low tax rate on the former—“long-term capital gains”—is a huge tax expenditure. Taxing income from wealth at a much lower rate than income from work is extremely regressive. The richer you are the more likely you are to have capital assets to sell and thus the higher the subsidy you get from the capital gains tax rate.
Who benefits? See the chart below for how much of their after-tax income households at different income levels get from the preferential tax rate on capital gains.
The preferential tax rate on long-term capital gains: Benefits as a percent of after-tax income
| Income bracket | Preferential tax rate on long-term capital gains and dividends |
|---|---|
| Bottom 20% | 0% |
| 21–40th | 0 |
| 41–60th | 0.1 |
| 61–80th | 0.2 |
| 81–90th | 0.2 |
| 91–95th | 0.4 |
| 96–99th | 1 |
| Top 1% | 5.9 |
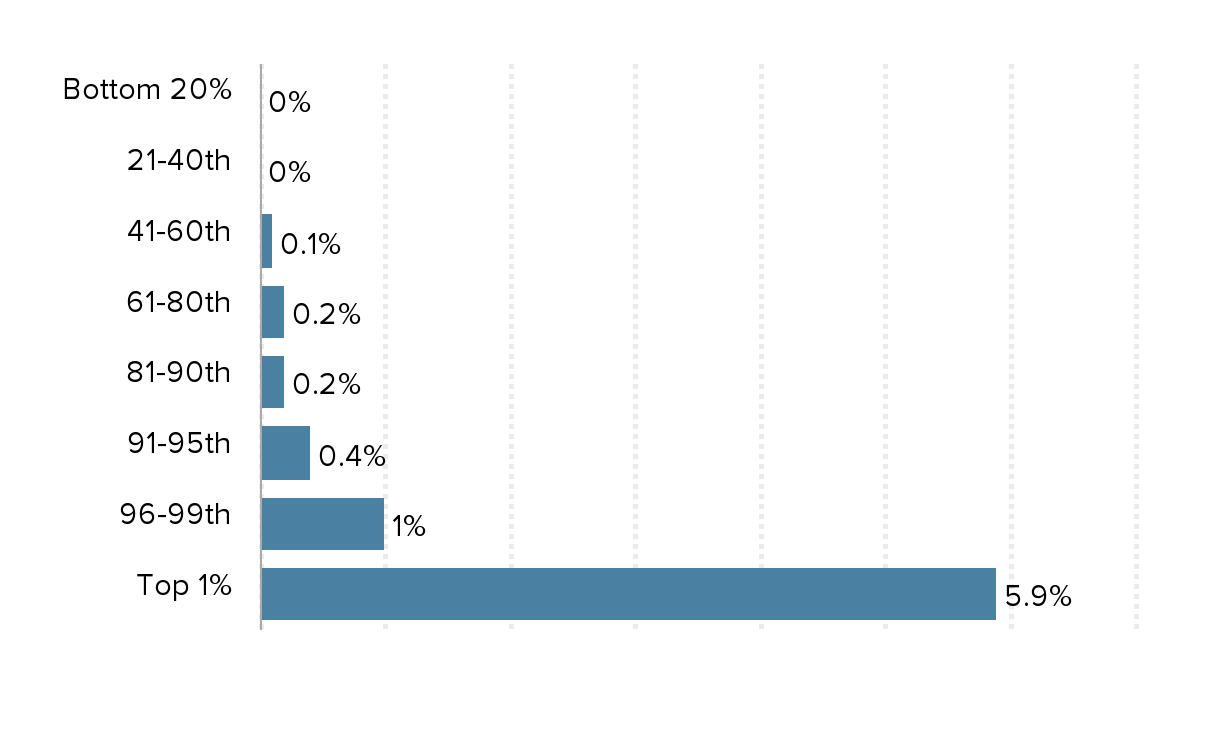
Tax Policy Center, Individual Income Tax Expenditures [online database], T18-0183, October 2018. Data are for 2018.