International comparisons
The United States taxes a lot less, and spends a lot less, than almost every other rich country.
Even if U.S. spending in coming decades rises as much as some have projected it will, U.S. taxing and spending levels would still fall well short of most of our advanced country peers. These low tax and spending levels limit how much the U.S. tax and spending system can push back on inequality and fight poverty.
Public spending in the U.S. is low relative to other rich nations—and even a big increase in future spending wouldn’t make the U.S. a high spender.
Right now, when it comes to public spending, the U.S. spends less—as a share of GDP—than all but three of its rich country peers. Rising health care costs are projected to drive a big increase in U.S. government spending in the years ahead. But even if no reforms are undertaken to slow these health care costs, total U.S. government spending in 2048 would still be lower than current spending by many of our rich country peers.
Total government spending as a share of GDP in the 20 richest countries
| Country | Share of GDP |
|---|---|
| France | 55.6% |
| Finland | 53.3% |
| Belgium | 52.1% |
| Norway | 51.5% |
| Sweden | 49.3% |
| Denmark | 49.2% |
| Italy | 48.6% |
| Austria | 48.4% |
| Germany | 45.2% |
| Iceland | 43.4% |
| Slovenia | 43.3% |
| Non-U.S. average | 42.7% |
| Luxembourg | 42.2% |
| Spain | 42.1% |
| Netherlands | 42.0% |
| Canada | 41.7% |
| Czech Republic | 41.3% |
| UK | 41.0% |
| Israel | 39.9% |
| New Zealand | 39.8% |
| Japan | 39.0% |
| Estonia | 38.9% |
| Australia | 38.6% |
| United States | 37.8% |
| Lithuania | 34.6% |
| Switzerland | 32.7% |
| Korea | 31.2% |
| Ireland | 24.5% |
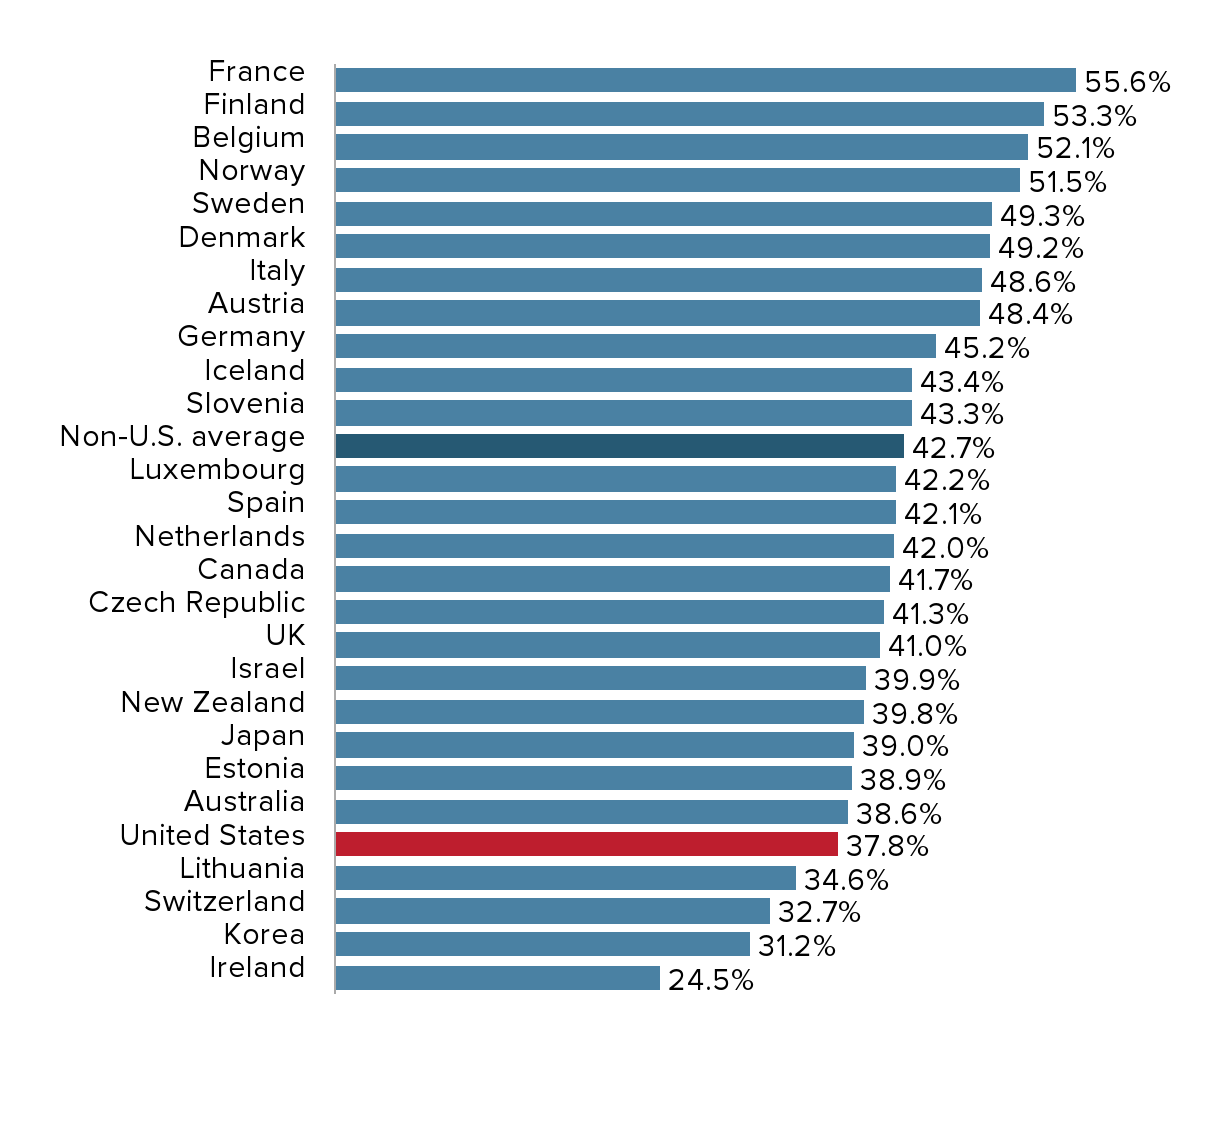
Organisation for Economic Co-operation and Development (OECD), OECD.Stat online database, accessed April 2021. Data are for 2019. Total government spending includes all levels of government (for example local, state, and federal for the U.S.) and interest spending. Spending levels in 2048 assume spending rises as projected by the Congressional Budget Office (The 2018 Long-Term Budget Outlook, June 2018) and no changes are made to current health care policy. Cross-country comparisons look at total, not just federal, spending to accommodate widely different government structures.
The U.S. taxes much less than other rich countries—and taxes would stay relatively low even if they rose to finance projected spending increases.
The United States is second from the bottom in terms of revenues collected as a share of GDP. It would not become a high-tax country even if rising health care costs drive a big increase in U.S. public spending that is financed by raising taxes. If no policy change checks health care cost growth, by 2048 the United States would still need to raise only as much in taxes as several other rich countries raise today.
General government revenue as a share of GDP in the 20 richest countries
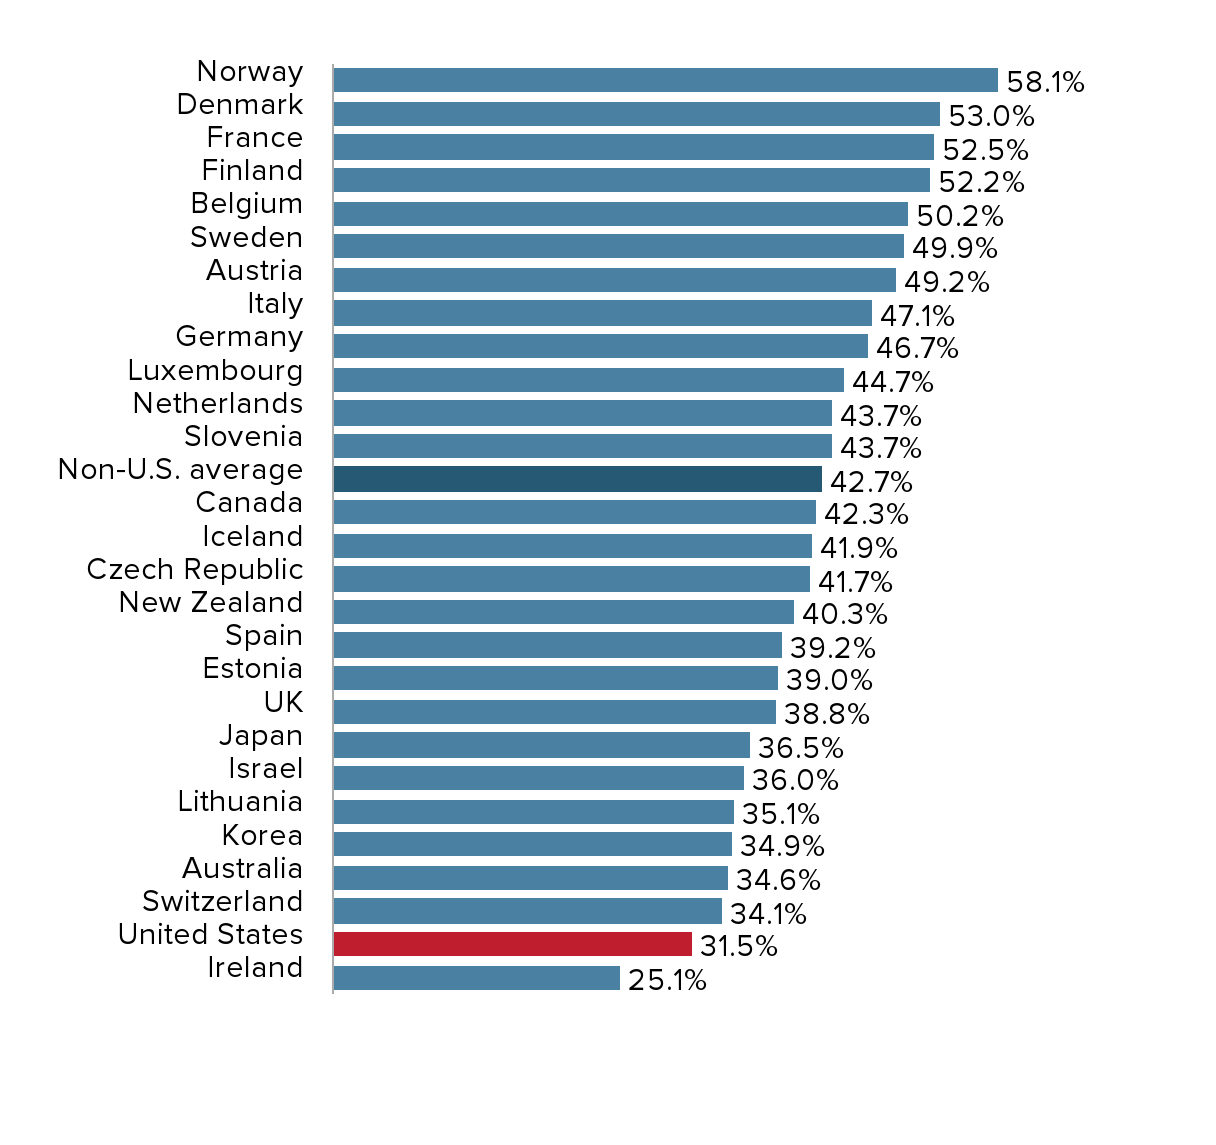
Organisation for Economic Co-operation and Development (OECD), OECD.Stat online database, accessed April 2021. Data are for 2019. Total government revenue includes revenues accruing to all levels of government (for example local, state, and federal for the U.S.).
Public spending to reduce child poverty is lower in the U.S. than in any other rich nation.
Countries invest in their future when they invest in the health, education, and well-being of children. It is especially important for countries to invest in children from poorer families that don’t earn enough (i.e., don’t have enough “market income”) to afford these necessities. The U.S. lags far behind its international peers when it comes to this kind of investment. On average, the U.S. spends about a third as much on families with children as the average non-U.S. rich country (0.7% vs. 2.1% as a share of GDP). Given that the United States spends the least on social programs for families among its peers, it’s not surprising that it has the second-highest child poverty rate (Source).
Family benefits public spending as a share of GDP in the 20 richest countries
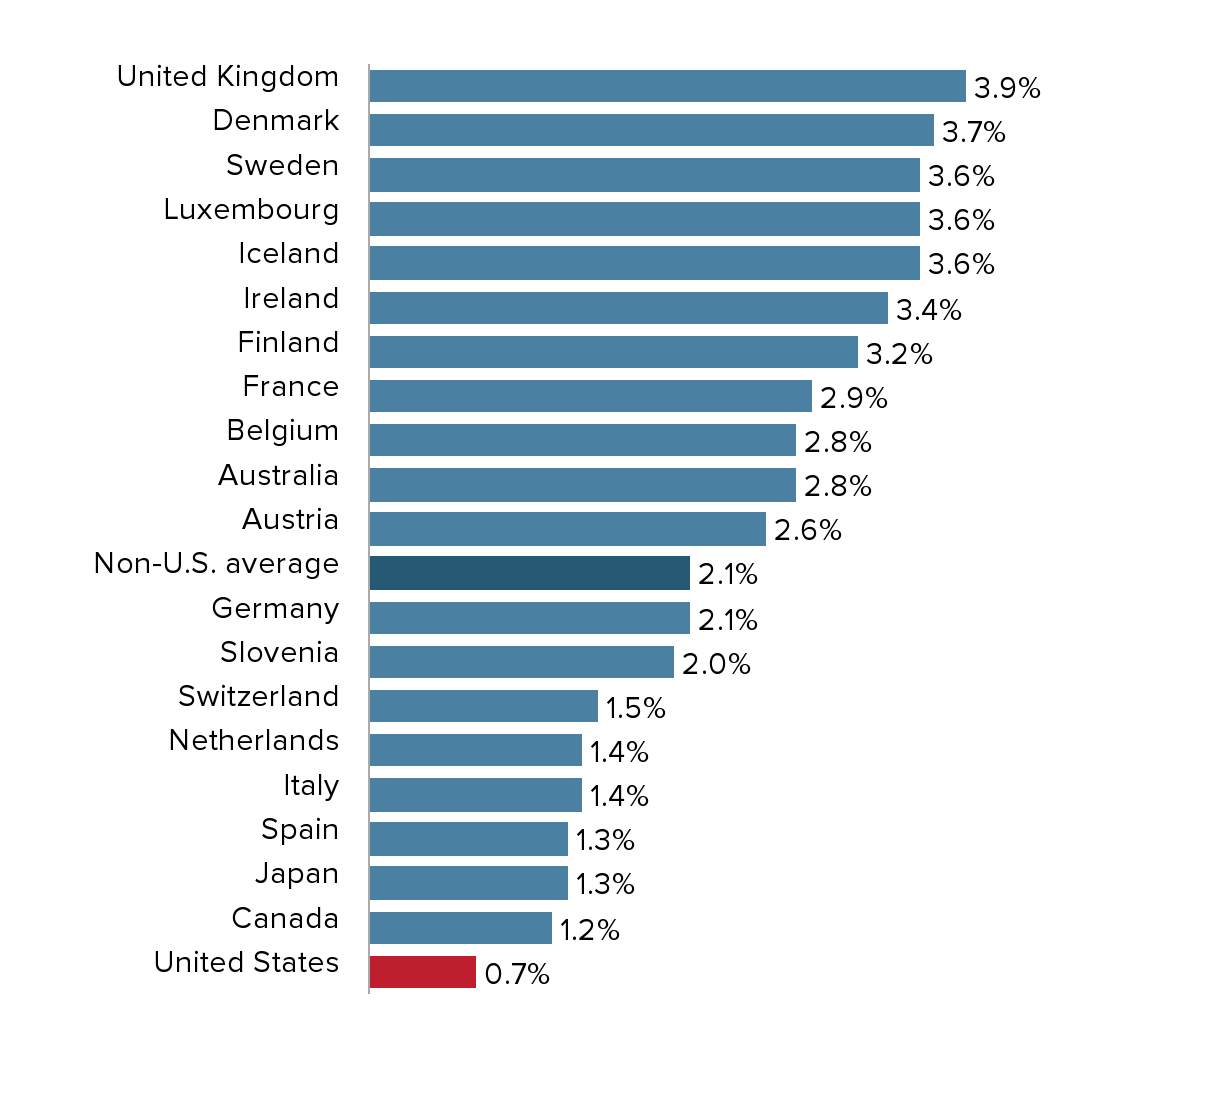
Organisation for Economic Co-operation and Development (OECD), OECD.Stat online database, accessed April 2021. Data are for 2017. The OECD defines family benefits public spending as cash benefits to families with children, public spending on services for families (including early childhood education but excluding K–12 education), and financial support for families provided through the tax system. It includes spending at all levels of government.
The U.S. tax and spending system does less to fight poverty than systems in all other rich countries.
One consequence of low public spending in the U.S. is a higher poverty rate. The U.S. and other rich countries have a spectrum of programs that transfer resources to households with specific needs. Some of these “transfer” programs are safety net programs or tax credits that kick in to support people when their earnings aren’t enough to meet basic expenses. Other transfer programs are social insurance programs (like Social Security in the U.S.)—people at all income levels pay into these programs and get benefits back when they need them.
Transfers are often directly targeted to combat poverty. And their poverty-reducing effect is even greater when you add in features of the tax system that shift resources to families further down the income scale. But of all the rich countries, the U.S. has the weakest tax-and-transfer system when it comes to fighting poverty.
U.S. poverty rate before and after taxes and transfers
| Category | Poverty rate |
|---|---|
| Before | 26.8% |
| After | 17.8% |
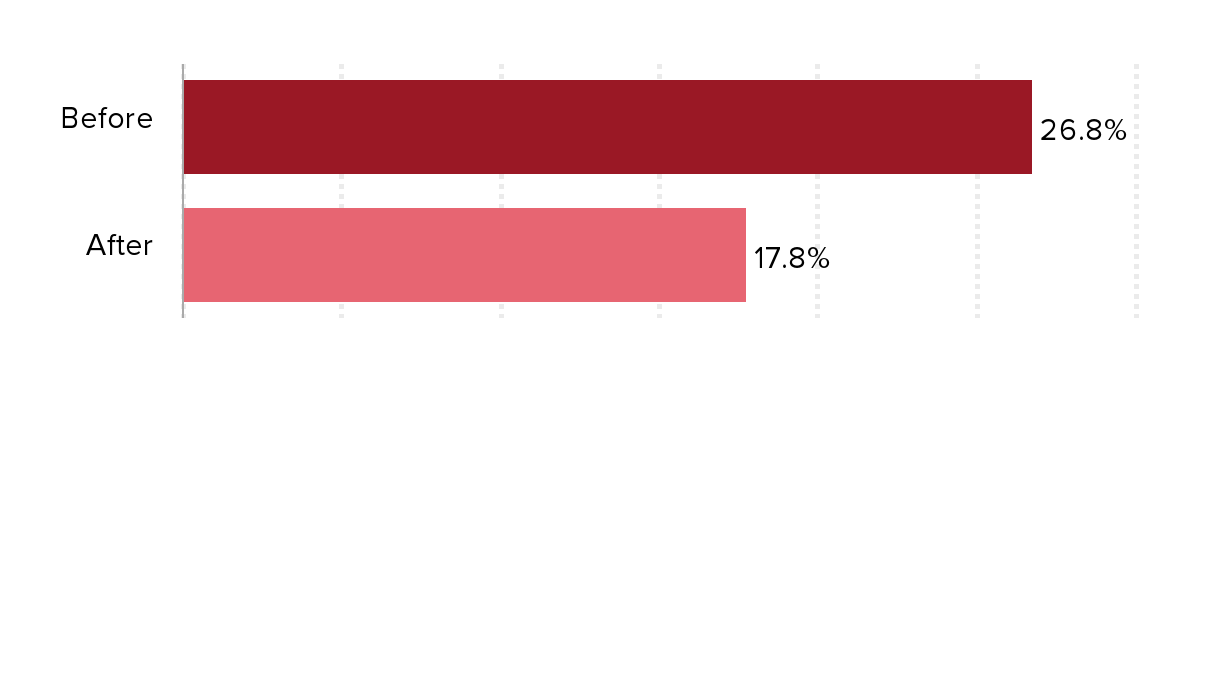
Organisation for Economic Co-operation and Development, OECD.Stat online database, accessed April 2021. The poverty rate here is an OECD harmonized rate—the share of households earnings less than half the median household income.
Reduction in poverty achieved by taxes and transfers
| Country | Reduction in Poverty |
|---|---|
| Finland | 83.1% |
| Czech Republic | 79.7% |
| France | 77.6% |
| Denmark | 76.4% |
| Belgium* | 75.2% |
| Ireland | 74.3% |
| Slovenia | 70.0% |
| Austria | 69.6% |
| Netherlands | 69.0% |
| Germany | 68.2% |
| Norway | 68.0% |
| Luxembourg | 66.4% |
| Iceland | 65.9% |
| Sweden | 63.5% |
| United Kingdom | 62.4% |
| Non-U.S. average | 60.5% |
| Italy | 59.5% |
| Spain | 57.1% |
| New Zealand* | 53.2% |
| Japan* | 52.4% |
| Australia | 52.0% |
| Canada | 49.4% |
| Estonia | 47.0% |
| Switzerland | 38.5% |
| United States | 33.1% |
| Israel | 22.0% |
| Korea | 11.1% |
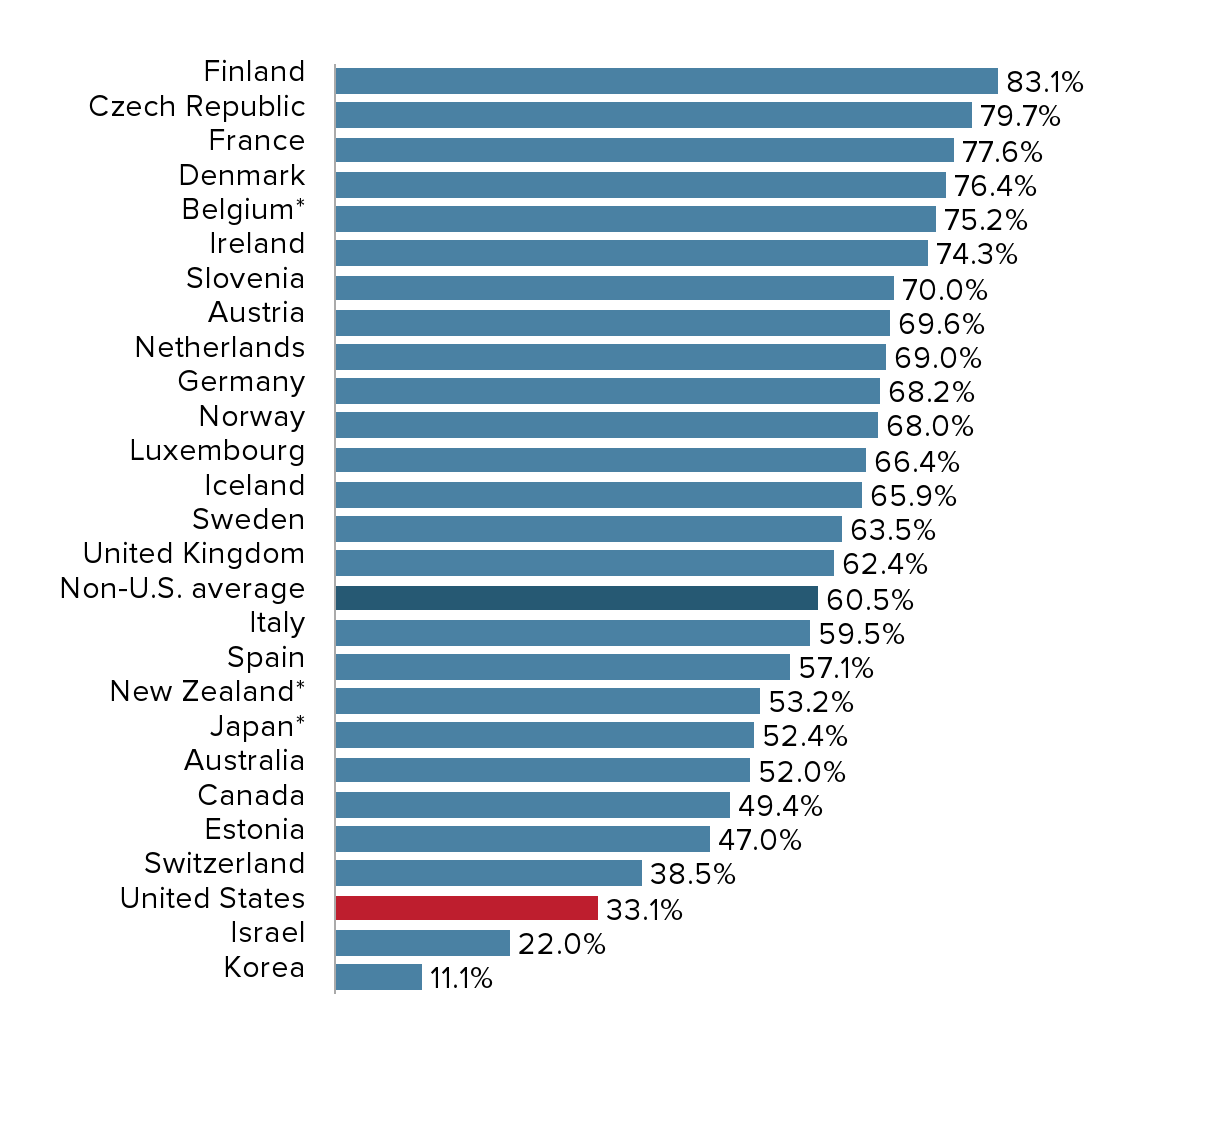
*Data are for 2016 with the exceptions of Belgium (2018), New Zealand (2014), and Japan (2015)
Organisation for Economic Co-operation and Development (OECD), OECD.Stat online database, accessed April 2021. Data are for 2016.