What to watch on jobs day: An improving labor market, but rising long-term unemployment and a significant jobs shortfall are still causes for concern
When the April jobs report comes out tomorrow from the Bureau of Labor Statistics, I expect another month of strong job growth. Progress on the production and distribution of the vaccine, as well as forthcoming aid to state and local governments and direct assistance to workers and their families, means that the labor market should pick up steam. And that’s much needed, because the U.S. economy is still facing a significant jobs shortfall between 9.1 million and 11.0 million jobs, as I show below.
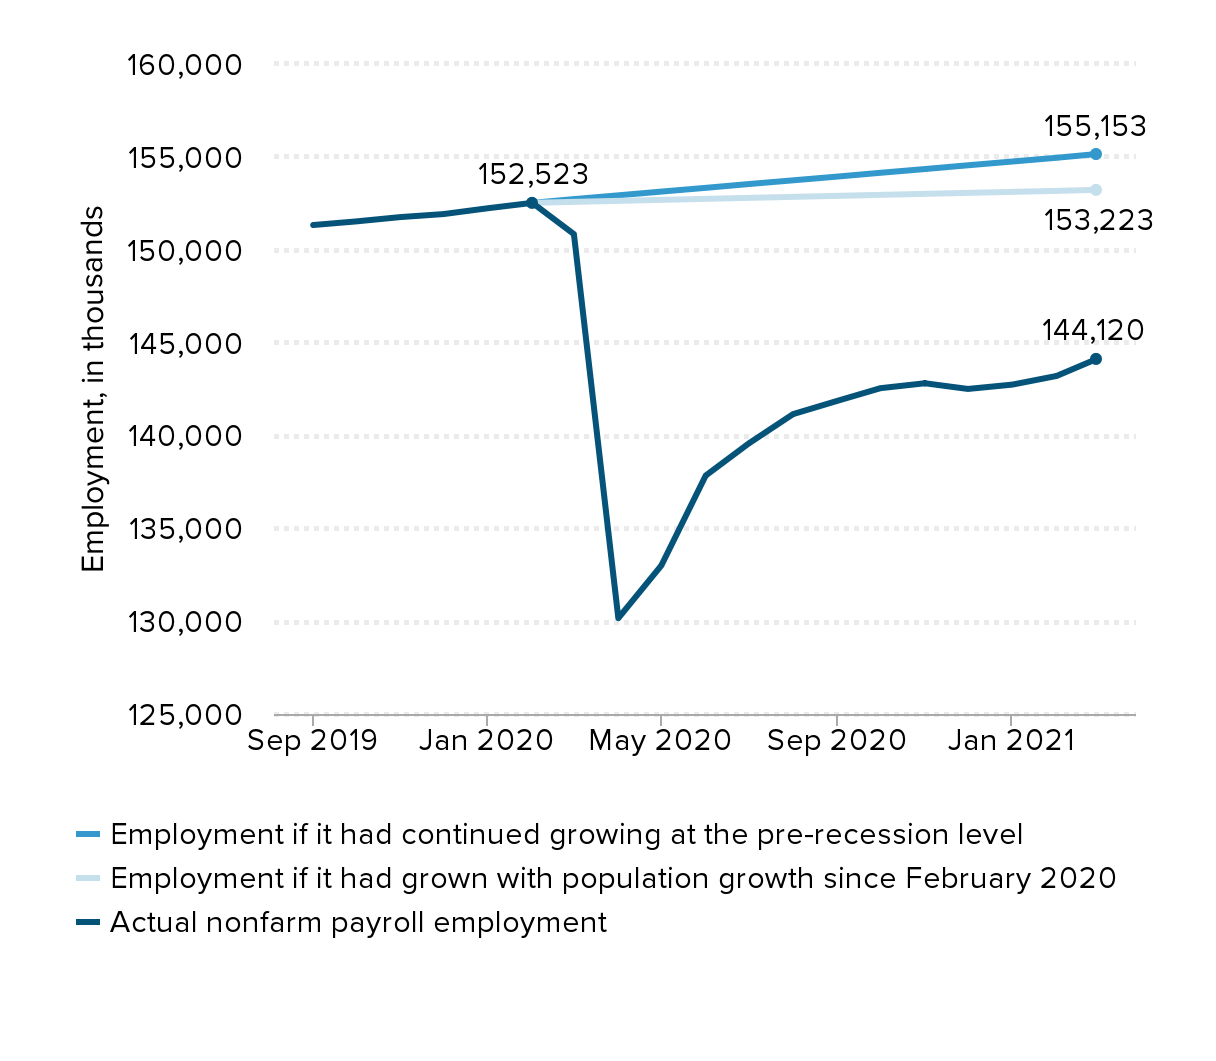
As of the latest March 2021 data, employment is down 8.4 million jobs from its pre-pandemic level in February 2020. In addition, thousands of jobs would have been added each month over the last year without the pandemic recession.
I consider two plausible counterfactuals for how many jobs may have been created if the recession hadn’t hit, as shown in the figure below. First, we could simply add enough jobs to keep up with population growth. There was a noticeable slowdown in ages 16+ population growth early in the pandemic; however, on average, we still would have needed a minimum of 54,000 jobs a month just to keep up with that growth.
Alternatively, we could count how many jobs may have been added if we took pre-recession growth in payroll employment and extended that forward. Average monthly job growth over the 12 months prior the recession was 202,000. Using these reasonable counterfactuals, we are now short between 9.1 million and 11.0 million jobs since February 2020. When the latest job numbers are released tomorrow, we should not only look at the difference in jobs between now and February 2020, but also what could have been if the economy continued growing over the last year.
Measuring the job shortfall since February 2020 : Actual and counterfactual employment, September 2019–March 2021
| Date | Actual nonfarm payroll employment | Employment if it had continued growing at the pre-recession level | Employment if it had grown with population growth since February 2020 |
|---|---|---|---|
| Sep-2019 | 151,329 | ||
| Oct-2019 | 151,524 | ||
| Nov-2019 | 151,758 | ||
| Dec-2019 | 151,919 | ||
| Jan-2020 | 152,234 | ||
| Feb-2020 | 152,523 | 152,523 | 152,523 |
| Mar-2020 | 150,840 | 152,725 | 152,577 |
| Apr-2020 | 130,161 | 152,928 | 152,631 |
| May-2020 | 132,994 | 153,130 | 152,685 |
| Jun-2020 | 137,840 | 153,332 | 152,738 |
| Jul-2020 | 139,566 | 153,535 | 152,792 |
| Aug-2020 | 141,149 | 153,737 | 152,846 |
| Sep-2020 | 141,865 | 153,939 | 152,900 |
| Oct-2020 | 142,545 | 154,142 | 152,954 |
| Nov-2020 | 142,809 | 154,344 | 153,008 |
| Dec-2020 | 142,503 | 154,546 | 153,061 |
| Jan-2021 | 142,736 | 154,749 | 153,115 |
| Feb-2021 | 143,204 | 154,951 | 153,169 |
| Mar-2021 | 144,120 | 155,153 | 153,223 |
Notes: Payroll employment growth averaged 202,000 in the 12 months leading up to the pandemic recession. Population-adjusted employment growth applies population growth in the latest month since February 2020 to payroll employment and interpolates in the intervening years. Seasonally adjusted population growth is backed out from seasonally adjusted data on employment and EPOPs.
Source: EPI analysis of Bureau of Labor Statistics Current Population Survey public data series.
While the overall jobs shortfall is useful to track, we also need to pay attention to the latest numbers across various sectors of the economy. In March, we started to see a significant uptick in low-wage leisure and hospitality employment. If we get continued job growth like we saw last month in this sector, it will provide further evidence against mostly anecdotal claims of labor shortages. As my colleague Heidi Shierholz explains, claims of labor shortages are likely overblown. Wage growth would be accelerating if there were actual labor shortages as employers compete for workers, but that isn’t happening. It is plausible that some workers may be staying out of the labor force because they are unwilling to accept low wages with the added risks of physically going to work while the pandemic continues to spread, but, again, we’d be seeing accelerating wage growth to entice these workers if this were happening in large numbers. Furthermore, on the specific question of whether the pandemic unemployment insurance programs’ increased generosity is keeping workers out of the labor force, Heidi points to several rigorous papers that find no evidence that these programs have kept people from taking jobs in the recent past.
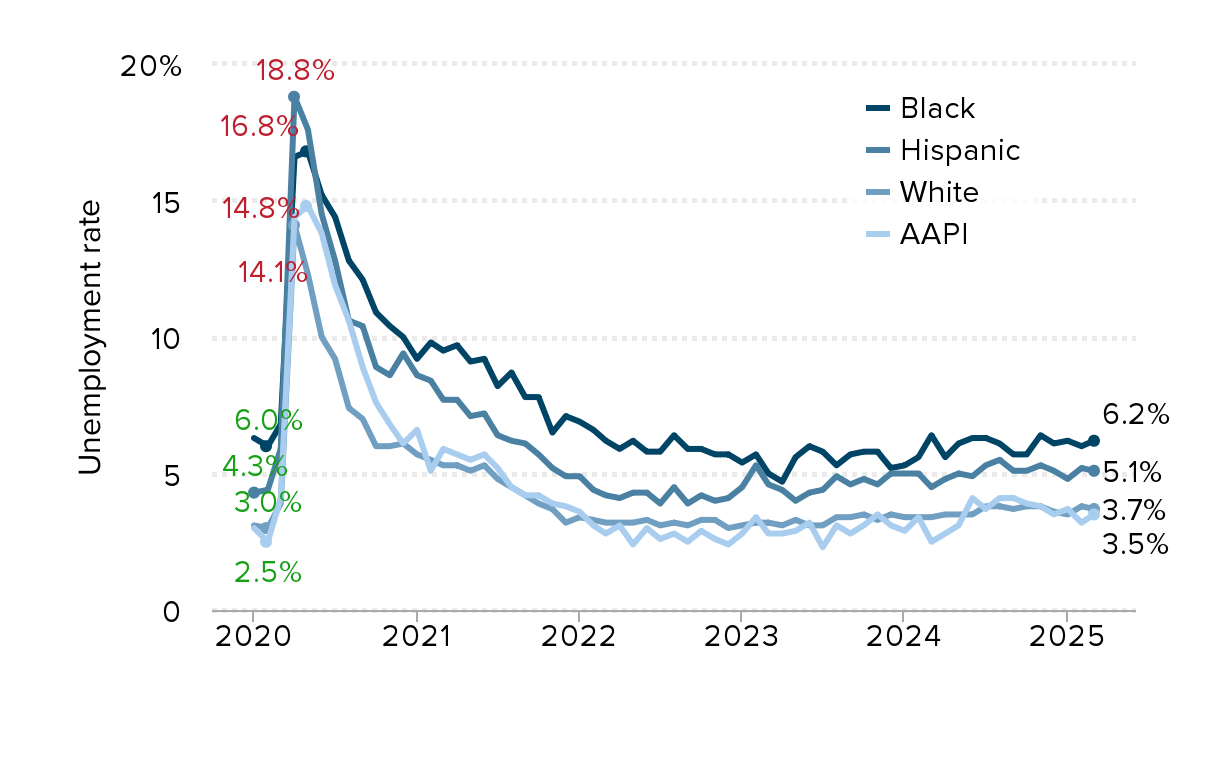
As the recovery takes hold, we also need to continue tracking which workers are being left behind. The pandemic exacerbated stark and persistent racial and ethnic disparities that remain in the labor market today. One example is seen by looking at the unemployment rate across race and ethnic groups. Before the pandemic, the unemployment rate for Black workers was higher than the current unemployment rate for white workers. Now, the current unemployment rate for Black workers is 9.6%, almost as high as the peak for all workers in the aftermath of the Great Recession.
Unemployment rate of workers age 16 and older by race and ethnicity, January 2020–March 2025
| Date | White | Black | Hispanic | AAPI |
|---|---|---|---|---|
| Jan-2020 | 3.1% | 6.3% | 4.3% | 3% |
| Feb-2020 | 3% | 6% | 4.4% | 2.5% |
| Mar-2020 | 3.9% | 6.8% | 5.9% | 4.1% |
| Apr-2020 | 14.1% | 16.6% | 18.8% | 14.4% |
| May-2020 | 12.3% | 16.8% | 17.6% | 14.8% |
| Jun-2020 | 10.0% | 15.2% | 14.5% | 13.8% |
| Jul-2020 | 9.2% | 14.4% | 12.8% | 11.9% |
| Aug-2020 | 7.4% | 12.8% | 10.6% | 10.6% |
| Sep-2020 | 7.0% | 12.1% | 10.4% | 8.9% |
| Oct-2020 | 6.0% | 10.9% | 8.9% | 7.6% |
| Nov-2020 | 6.0% | 10.4% | 8.6% | 6.8% |
| Dec-2020 | 6.1% | 10.0% | 9.4% | 6.1% |
| Jan-2021 | 5.7% | 9.2% | 8.6% | 6.6% |
| Feb-2021 | 5.5% | 9.8% | 8.4% | 5.1% |
| Mar-2021 | 5.3% | 9.5% | 7.7% | 5.9% |
| Apr-2021 | 5.3% | 9.7% | 7.7% | 5.7% |
| May-2021 | 5.1% | 9.1% | 7.1% | 5.5% |
| Jun-2021 | 5.3% | 9.2% | 7.2% | 5.7% |
| Jul-2021 | 4.8% | 8.2% | 6.4% | 5.2% |
| Aug-2021 | 4.5% | 8.7% | 6.2% | 4.5% |
| Sep-2021 | 4.2% | 7.8% | 6.1% | 4.2% |
| Oct-2021 | 3.9% | 7.8% | 5.7% | 4.2% |
| Nov-2021 | 3.7% | 6.5% | 5.2% | 3.9% |
| Dec-2021 | 3.2% | 7.1% | 4.9% | 3.8% |
| Jan-2022 | 3.4% | 6.9% | 4.9% | 3.6% |
| Feb-2022 | 3.3% | 6.6% | 4.4% | 3.1% |
| Mar-2022 | 3.2% | 6.2% | 4.2% | 2.8% |
| Apr-2022 | 3.2% | 5.9% | 4.1% | 3.1% |
| May-2022 | 3.2% | 6.2% | 4.3% | 2.4% |
| Jun-2022 | 3.3% | 5.8% | 4.3% | 3% |
| Jul-2022 | 3.1% | 5.8% | 3.9% | 2.6% |
| Aug-2022 | 3.2% | 6.4% | 4.5% | 2.8% |
| Sep-2022 | 3.1% | 5.9% | 3.9% | 2.5% |
| Oct-2022 | 3.3% | 5.9% | 4.2% | 2.9% |
| Nov-2022 | 3.3% | 5.7% | 4% | 2.6% |
| Dec-2022 | 3% | 5.7% | 4.1% | 2.4% |
| Jan-2023 | 3.1% | 5.4% | 4.5% | 2.8% |
| Feb-2023 | 3.2% | 5.7% | 5.3% | 3.4% |
| Mar-2023 | 3.2% | 5.0% | 4.6% | 2.8% |
| Apr-2023 | 3.1% | 4.7% | 4.4% | 2.8% |
| May-2023 | 3.3 | 5.6 | 4 | 2.9 |
| Jun-2023 | 3.1 | 6.0 | 4.3 | 3.2 |
| Jul-2023 | 3.1 | 5.8 | 4.4 | 2.3 |
| Aug-2023 | 3.4 | 5.3 | 4.9 | 3.1 |
| Sept-2023 | 3.4% | 5.7% | 4.6% | 2.8% |
| Oct-2023 | 3.5% | 5.8% | 4.8% | 3.1% |
| Nov-2023 | 3.3% | 5.8% | 4.6% | 3.5% |
| Dec-2023 | 3.5% | 5.2% | 5.0% | 3.1% |
| Jan-2024 | 3.4% | 5.3% | 5.0% | 2.9% |
| Feb-2024 | 3.4% | 5.6% | 5.0% | 3.4% |
| Mar-2024 | 3.4% | 6.4% | 4.5% | 2.5% |
| Apr-2024 | 3.5% | 5.6% | 4.8% | 2.8% |
| May-2024 | 3.5% | 6.1% | 5.0% | 3.1% |
| Jun-2024 | 3.5% | 6.3% | 4.9% | 4.1% |
| Jul-2024 | 3.8% | 6.3% | 5.3% | 3.7% |
| Aug-2024 | 3.8% | 6.1% | 5.5% | 4.1% |
| Sept-2024 | 3.7% | 5.7% | 5.1% | 4.1% |
| Oct-2024 | 3.8% | 5.7% | 5.1% | 3.9% |
| Nov-2024 | 3.8% | 6.4% | 5.3% | 3.8% |
| Dec-2024 | 3.6% | 6.1% | 5.1% | 3.5% |
| Jan-2025 | 3.5% | 6.2% | 4.8% | 3.7% |
| Feb-2025 | 3.8% | 6.0% | 5.2% | 3.2% |
| Mar-2025 | 3.7% | 6.2% | 5.1% | 3.5% |
Note: AAPI refers to Asian American and Pacific Islander. Racial and ethnic categories are not mutually exclusive; white and Black data do not exclude Latinx workers of each race.
Source: EPI analysis of Bureau of Labor Statistics’ Current Population Survey public data.
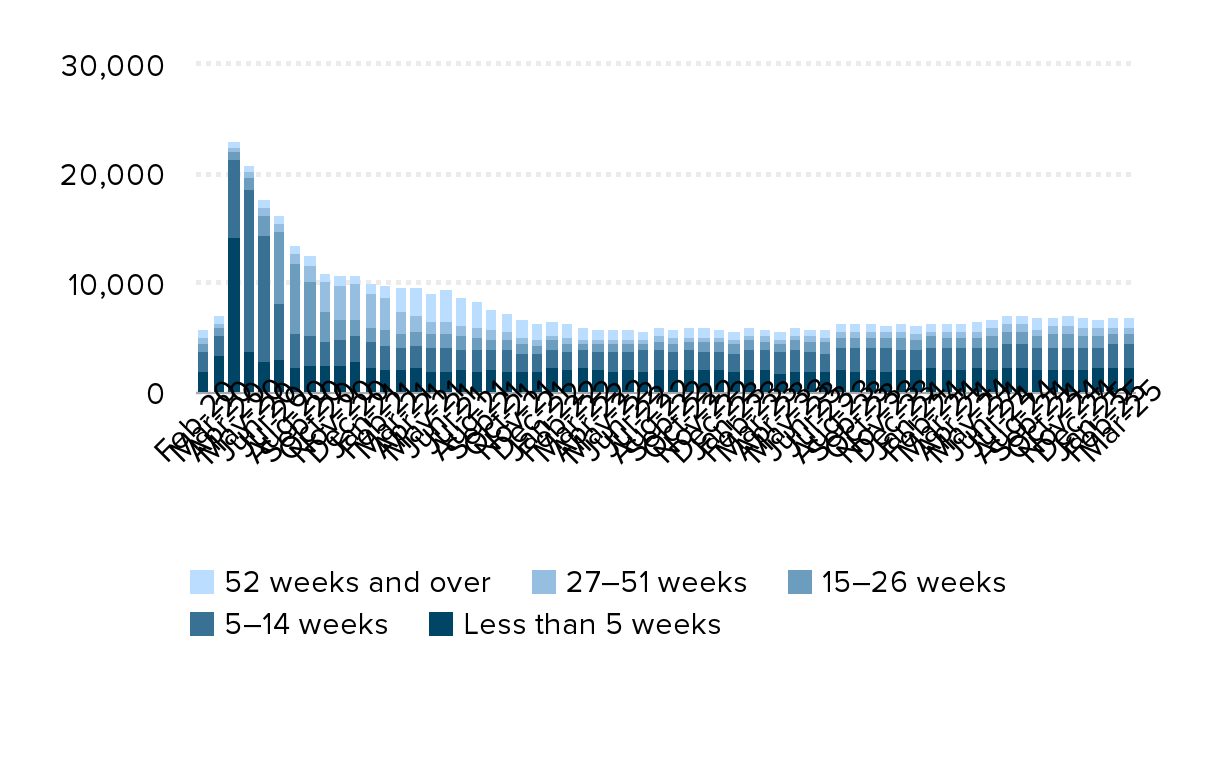
Elevated unemployment rates are concerning as are the growing numbers of workers who are unemployed for longer and longer spells. In September and October 2020, the number of workers unemployed for 27+ weeks shot up as the pandemic recession dragged on for over six months. In the last couple of months, the number of workers with unemployment durations of at least 52 weeks rose dramatically from 915,000 in January 2021 to 2.3 million in March 2021. The figure below breaks out the unemployed population by length of unemployment spell. Although all expectations are for a strong growth in jobs, I fear that those who are 52+ weeks unemployed will also continue to grow.
As it becomes safe to expand employment—as public health indicators continue to improve with vaccine distribution—we need to make sure that job opportunities improve for all corners of the labor market.
Number of workers at each level of unemployment duration, by month, February 2020–March 2025
| date | Less than 5 weeks | 5–14 weeks | 15–26 weeks | 27–51 weeks | 52 weeks and over |
|---|---|---|---|---|---|
| Feb-20 | 2,088 | 1,780 | 789 | 429 | 681 |
| Mar-20 | 3,422 | 1,845 | 784 | 402 | 738 |
| Apr-20 | 14,263 | 7,066 | 782 | 418 | 492 |
| May-20 | 3,867 | 14,806 | 1,061 | 620 | 527 |
| Jun-20 | 2,909 | 11,522 | 1,917 | 697 | 658 |
| Jul-20 | 3,140 | 5,145 | 6,468 | 768 | 776 |
| Aug-20 | 2,316 | 3,105 | 6,506 | 809 | 823 |
| Sep-20 | 2,557 | 2,735 | 4,918 | 1579 | 866 |
| Oct-20 | 2,480 | 2,342 | 2,625 | 2798 | 793 |
| Nov-20 | 2,491 | 2,440 | 1,886 | 3097 | 827 |
| Dec-20 | 2,913 | 2,344 | 1,574 | 3150 | 817 |
| Jan-21 | 2,287 | 2,472 | 1,349 | 3106 | 926 |
| Feb-21 | 2,197 | 2,212 | 1,380 | 2909 | 1234 |
| Mar-21 | 2,177 | 1,972 | 1,395 | 1892 | 2279 |
| Apr-21 | 2,411 | 1,986 | 1,240 | 1416 | 2666 |
| May-21 | 1,997 | 2,181 | 1,296 | 1061 | 2646 |
| Jun-21 | 2,001 | 2,177 | 1,327 | 1073 | 2915 |
| Jul-21 | 2,245 | 1,851 | 1,160 | 1001 | 2476 |
| Aug-21 | 2,082 | 1,932 | 1,167 | 874 | 2315 |
| Sep-21 | 2,249 | 1,728 | 1,001 | 789 | 1925 |
| Oct-21 | 2,065 | 1,876 | 974 | 711 | 1660 |
| Nov-21 | 1,993 | 1,679 | 884 | 637 | 1544 |
| Dec-21 | 1,985 | 1,596 | 794 | 642 | 1351 |
| Jan-22 | 2,469 | 1,610 | 850 | 440 | 1216 |
| Feb-22 | 2,125 | 1,769 | 736 | 458 | 1231 |
| Mar-22 | 2,302 | 1,706 | 614 | 361 | 1019 |
| Apr-22 | 2,279 | 1,603 | 628 | 390 | 996 |
| May-22 | 2,030 | 1,760 | 741 | 372 | 922 |
| Jun-22 | 2,256 | 1,525 | 750 | 470 | 885 |
| Jul-22 | 2,084 | 1,858 | 697 | 295 | 825 |
| Aug-22 | 2,190 | 1,845 | 808 | 411 | 820 |
| Sep-22 | 2,168 | 1,627 | 863 | 439 | 679 |
| Oct-22 | 2,204 | 1,803 | 769 | 436 | 778 |
| Nov-22 | 2,253 | 1,663 | 795 | 430 | 814 |
| Dec-22 | 2,229 | 1,645 | 821 | 428 | 645 |
| Jan-23 | 1,941 | 1,796 | 921 | 372 | 715 |
| Feb-23 | 2,272 | 1,841 | 814 | 442 | 614 |
| Mar-23 | 2,275 | 1,746 | 792 | 405 | 656 |
| Apr-23 | 1,869 | 1,915 | 772 | 377 | 702 |
| May-23 | 2,079 | 1,869 | 907 | 409 | 733 |
| Jun-23 | 2,082 | 1,833 | 895 | 449 | 672 |
| Jul-23 | 1,994 | 1,745 | 960 | 503 | 693 |
| Aug-23 | 2,198 | 1,931 | 921 | 588 | 781 |
| Sep-23 | 2,066 | 2,056 | 1,040 | 486 | 756 |
| Oct-23 | 2,285 | 1,835 | 1,031 | 530 | 801 |
| Nov-23 | 2,075 | 2,061 | 976 | 547 | 623 |
| Dec-23 | 2,204 | 1,794 | 1,072 | 539 | 734 |
| Jan-24 | 2,143 | 1,852 | 877 | 542 | 730 |
| Feb-24 | 2,339 | 1,942 | 970 | 445 | 768 |
| Mar-24 | 2,206 | 1,977 | 980 | 434 | 820 |
| Apr-24 | 2,273 | 1,990 | 879 | 558 | 695 |
| May-24 | 2,309 | 1,922 | 964 | 540 | 808 |
| Jun-24 | 2,130 | 2,108 | 1,066 | 737 | 796 |
| Jul-24 | 2,348 | 2,162 | 1,078 | 764 | 779 |
| Aug-24 | 2,465 | 2,029 | 1,153 | 696 | 849 |
| Sep-24 | 2,139 | 1,987 | 1,133 | 686 | 928 |
| Oct-24 | 2,109 | 2,082 | 1,231 | 711 | 897 |
| Nov-24 | 2,208 | 2,063 | 1,236 | 729 | 925 |
| Dec-24 | 2,156 | 1,997 | 1,207 | 641 | 910 |
| Jan-25 | 2,290 | 1,935 | 1,161 | 642 | 801 |
| Feb-25 | 2,337 | 2,152 | 1,031 | 606 | 849 |
| Mar-25 | 2,362 | 2,146 | 1,006 | 559 | 936 |
Notes: Data are seasonally adjusted. Seasonally adjusted data for Less than 5 weeks, 5-14 weeks, 15-26 weeks, and 27+ weeks are provided by BLS. Seasonally adjusted data are not available for 52+ so we applied the ratio of not-seasonally adjusted 52+ to not-seasonally adjusted 27+ to the seasonally adjusted 27+ to impute a seasonally adjusted 52+. Seasonally adjusted data for 27-51 is estimated as the difference between our estimated 52+ seasonally adjust data and the 27+ seasonally adjusted data.
Source: EPI analysis of Bureau of Labor Statistics Current Population Survey public data series.
Enjoyed this post?
Sign up for EPI's newsletter so you never miss our research and insights on ways to make the economy work better for everyone.