It’s the beginning of the school year and teachers are once again opening up their wallets to buy school supplies
It’s the beginning of the school year, a time of eager anticipation and hopeful expectations. Amid the excitement, parents are engaged in practical tasks, including opening their wallets to stock their children’s backpacks with school supplies. Teachers, too, are gearing up to go back to their classrooms by opening their wallets to buy classroom supplies. An overwhelming majority of them—more than nine out of 10—will not be reimbursed for what they spend on supplies over the school year, according to survey data from the National Center for Education Statistics (NCES).
The nation’s K–12 public school teachers shell out, on average, $459 on school supplies for which they are not reimbursed (adjusted for inflation to 2018 dollars), according to the NCES 2011–2012 Schools and Staffing Survey (SASS). This figure does not include the dollars teachers spend but are reimbursed for by their school districts. The $459-per-teacher average is for all teachers, including the small (4.9%) share who do not spend any of their own money on school supplies.
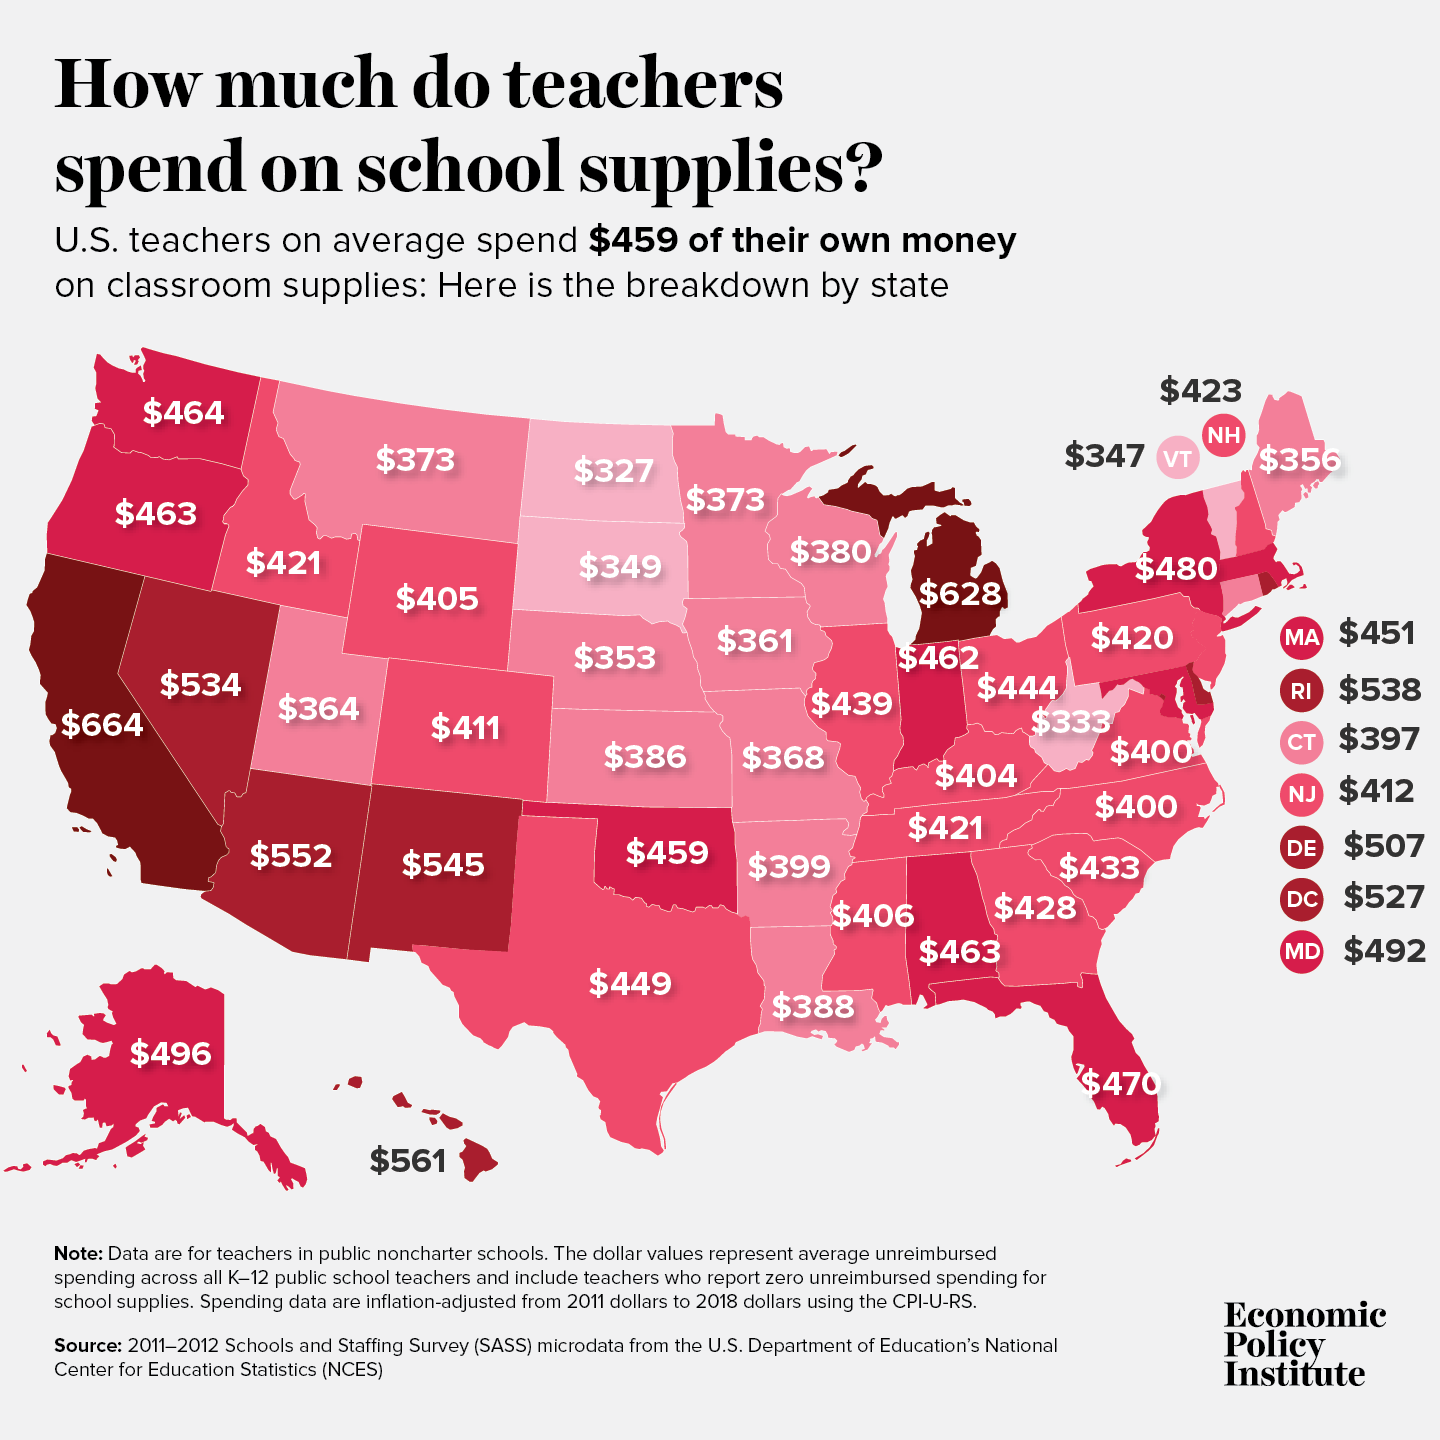
Unlike the data from the more recent 2015–2016 survey (now called National Teacher and Principal Survey or NTPS), the 2011–2012 SASS microdata provide state-by-state information, allowing us to see how much teachers spend on supplies by state. The map below shows the inflation-adjusted state-by-state spending. We know that the figures in the map are not an atypical high driven by the Great Recession because the 2011–2012 spending levels are lower than spending levels in the 2015–2016 NTPS data. The figure after the map shows that teachers’ unreimbursed school supply spending has actually increased overall since the recovery.
So how much do teachers in each state and the District of Columbia spend—unreimbursed—on supplies? The map shows a wide variation, with teachers on average spending $327 in North Dakota on the low end of the spectrum and $664 in California on the high end.
This variation should not be interpreted as a variation in teachers’ altruism. State-by-state spending differences are likely due to a combination of factors, including students’ needs, how schools are funded in the state, the cost of living in the state, and other factors. Although not shown on the map, there is just a slight variation in the shares of teachers buying unreimbursed classroom supplies, with a minimum of 91% in Mississippi and a maximum of 98% in Hawaii. The dollar amounts and shares paint a unifying, generalized pattern of generosity across the country.
That teachers subsidize schools should come as no surprise. In some districts, teachers are increasingly called on to serve as first responders when it comes to children’s basic needs. That generosity extends to filling the gap when schools, districts, and states don’t provide all the needed educational goods. And for teachers in high-poverty schools, filling the gap is costlier.
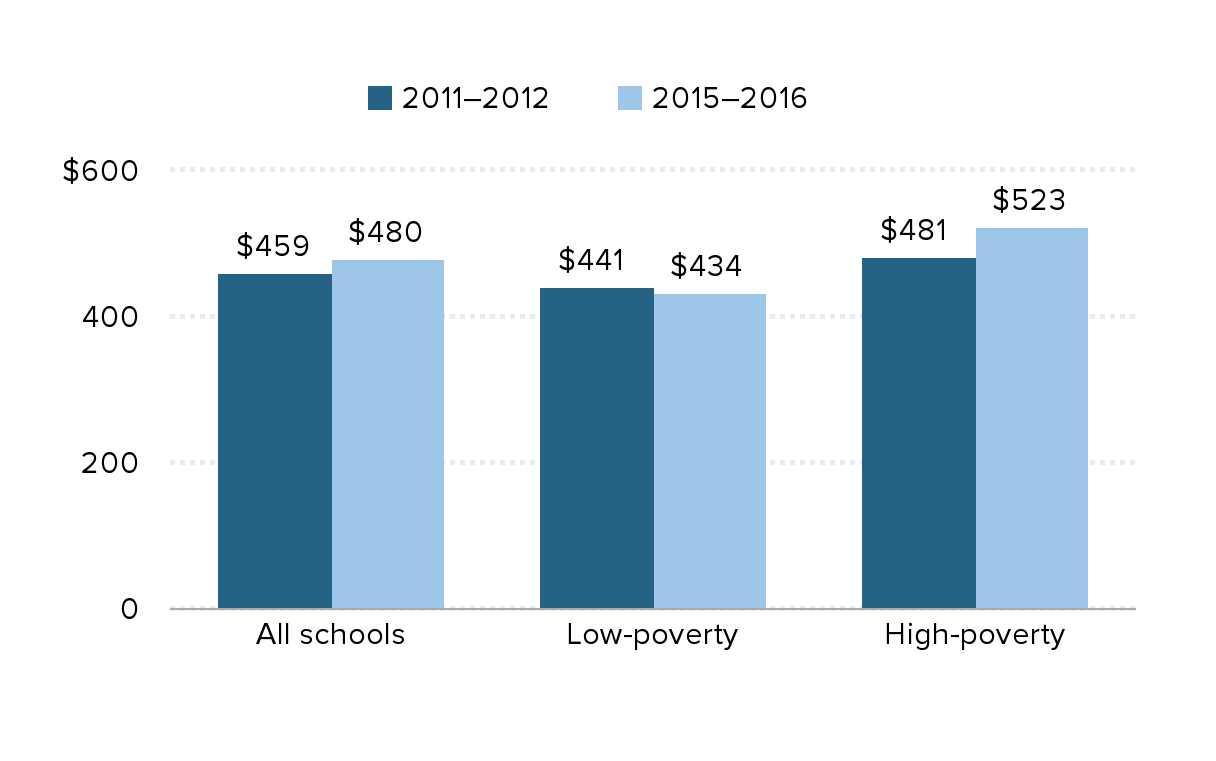
The figure below shows that teachers in high-poverty schools are spending more of their own money on school supplies than are teachers in low-poverty schools. This gap may reflect greater needs among students in high-poverty schools and more deficient funding systems for those schools. (Unfortunately, the data do not allow us to decompose the types of expenses or disentangle the reasons why a teacher spent money and was or was not reimbursed for it.) The figure also shows that teacher school supply spending is increasing overall and in high-poverty schools, but not in low-poverty schools. That may be a reflection of the economic cycle, with the recovery from the Great Recession having kicked into higher gear by the 2015–2016 school year and possibly playing a role in the decreased spending from teachers in low-poverty schools.
Teacher spending on school supplies is higher in high-poverty schools and increasing overall: Unreimbursed teacher spending on classroom supplies, 2011–2012 and 2015–2016 school years, all schools and by poverty level
| 2011–2012 | 2015–2016 | |
|---|---|---|
| All schools | $459 | $480 |
| Low-poverty | $441 | $434 |
| High-poverty | $481 | $523 |

Notes: Data are for teachers in public noncharter schools. The dollar values represent average spending across all K–12 public school teachers and include teachers who report zero unreimbursed spending for school supplies. Spending data are inflation-adjusted from 2011 dollars and 2015 dollars to 2018 dollars using the CPI-U-RS. A teacher is considered to be in a low-poverty school if less than 25% of the students in his or her classroom are eligible for free or reduced-price lunch programs; a teacher is considered to be in a high-poverty school if 50% or more of the students in his or her classroom are eligible for those programs.
Sources: 2011–2012 Schools and Staffing Survey (SASS) and 2015–2016 National Teacher and Principal Survey (NTPS) microdata from the U.S. Department of Education’s National Center for Education Statistics (NCES)
Teacher spending on school supplies is not in and of itself a major problem. It’s likely that if you meet a teacher in the checkout line as she or he is purchasing these supplies, the emotion you will see is excitement to welcome students back to the classroom and start a new year of learning. But unreimbursed spending could be seen as one more of many factors weighing on teachers and potentially affecting perceptions of the teaching profession, teacher recruitment, and teacher retention. EPI’s series on the teacher shortage has more comprehensive analysis of the factors that shape teacher labor markets.
Enjoyed this post?
Sign up for EPI's newsletter so you never miss our research and insights on ways to make the economy work better for everyone.

