January 5, 2007
Strong gains in wages and jobs as labor force expands to meet demand
By Jared Bernstein with research assistance by Rob Gray
The Bureau of Labor Statistics reported today that employers added 167,000 jobs in the last month of 2006, the strongest month for payroll growth since September, and well above analysts’ expectations. Unemployment was unchanged at 4.5%.
With the exception of the usual laggards in recent months—manufacturing and construction—most industries expanded, with strong gains in business services, health care, and restaurants. Wage growth was particularly strong, up 0.5% over the month, and 4.2% over the past year, well ahead of recent inflation readings.
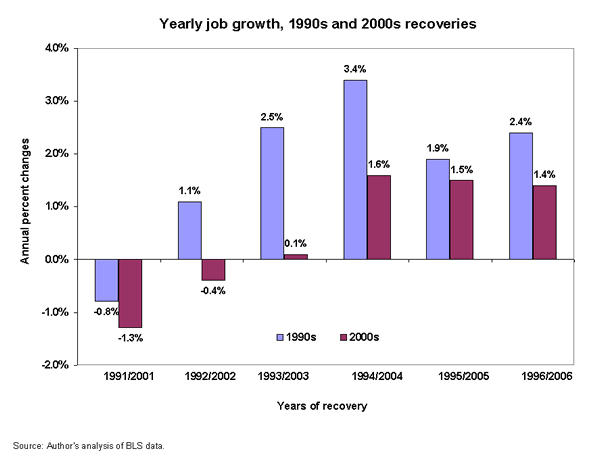
On average, payrolls gained 153,000 jobs per month in 2006, slightly behind the monthly averages of both 2005 (165,000) and 2004 (175,000). While this is average, it is relatively low compared to past recoveries (see figure below), 2006 ended with a strong job market characterized by low unemployment and solid wage gains.

The labor force grew more quickly than the working-age population in 2006, lifting the participation rate up to 66.4% from 66.0% in December 2005, a small but important increase. Given that labor force participation had been stuck around 66% for the past few years—well below its pre-recession peak—many economists argued that some structural shift had occurred, leading fewer people to participate in the job market. Others believed that participation rates were cyclically depressed by weak job creation.
Though the uptick is small and the rate remains about a point below peak, the fact that it is rising over a period of sustained job creation and stronger wage growth suggests that the improving job market is pulling in people who were previously sitting on the sidelines. A supporting indicator to this point is that the number of persons not in the labor force who currently want a job fell steadily this year, down by 750,000, the first annual decline in this series since 2002. One implication is that the job market is less supply-constrained than the argument suggested by the “structural camp”—i.e., participation is expanding to meet labor demand.
Other positive indicators in today’s report include a decline in African-American unemployment to 8.4%, the lowest since July 2001, though still more than twice the white rate of 4.0%. Unemployment duration indicators—measures of the time spent in the job search—also fell in December, reflecting a long-awaited downward trend. The share of long-term job seekers (looking for at least half a year) fell to 16.0% from 16.8% last month and 18.5% one year ago and the lowest since March 2002.
On the negative side, residential construction and related sectors continue to shed jobs. Our index of four sectors (residential building, contractors, real estate agents, and brokers) fell 10,000 last month and is down 19,000 jobs for the year. In 2005, these sectors added 306,000 jobs, revealing just how sharp this reversal has been.
Manufacturing employment also continues to slide, down 12,000 last month, the sixth consecutive monthly loss. Since the last economic peak (March 2001), manufacturing’s share of employment has fallen from 12.8% to 10.4%, a historically large loss in a sector with above-average job quality.
As noted, hourly earnings rose 4.2% in 2006, the fastest full-year growth rate (Dec/Dec) since 2000. Given the growth in average weekly hours this year, weekly earnings are up 4.5% on a yearly basis. These gains are solidly above inflation, which rose 2% in November, compared to 12 months earlier.
Putting these gains into context is important, both for evaluating living standards gains of working families and possible Federal Reserve reactions to faster wage growth. First, it’s worth noting that recent fast real wage growth was preceded by a long period of falling real earnings. Forecasting December inflation, we estimate that over the course of the recovery, real hourly earnings are up only 1.8%, while productivity growth is up 14.0% through the third quarter of this year.
Also, while hourly wage growth accelerated in December, on a yearly basis, it has been between 3.9% and 4.2% since August. Are employers passing these higher labor costs through to consumers in a manner that would suggest a threat from wage-push inflation?
While Fed officers have noted this very threat, there are good reasons for them to continue holding rates steady, allowing the job market to continue to steer real wage gains towards working families. As noted, the recent expansion of labor supply suggests more workers are entering the job market dampening a supply constraint that might worry Fed bankers. Second, most forecasts are for below-trend growth this year, suggesting the current strength of the job market could falter, further dampening any wage pressure. Third, core inflation has been relatively steady, if not falling slightly in recent reports.
Finally, we note that while today’s report reveals a healthy job market, employment has grown considerably more slowly in this recovery compared to that of the 1990s. The figure shows annual job growth (Dec/Dec) for comparable recovery years in the 1990s and 2000s. The slower pace of growth in this relative to the last recovery is evident, and should hopefully lead the Fed to allow the jobs machine to keep running apace.
To view archived editions of JOBS PICTURE, click here.
The Economic Policy Institute JOBS PICTURE is published each month upon release of the Bureau of Labor Statistics’ employment report.
EPI offers same-day analysis of income, price, employment, and other economic data released by U.S. government agencies. For more information, contact EPI at 202-775-8810.