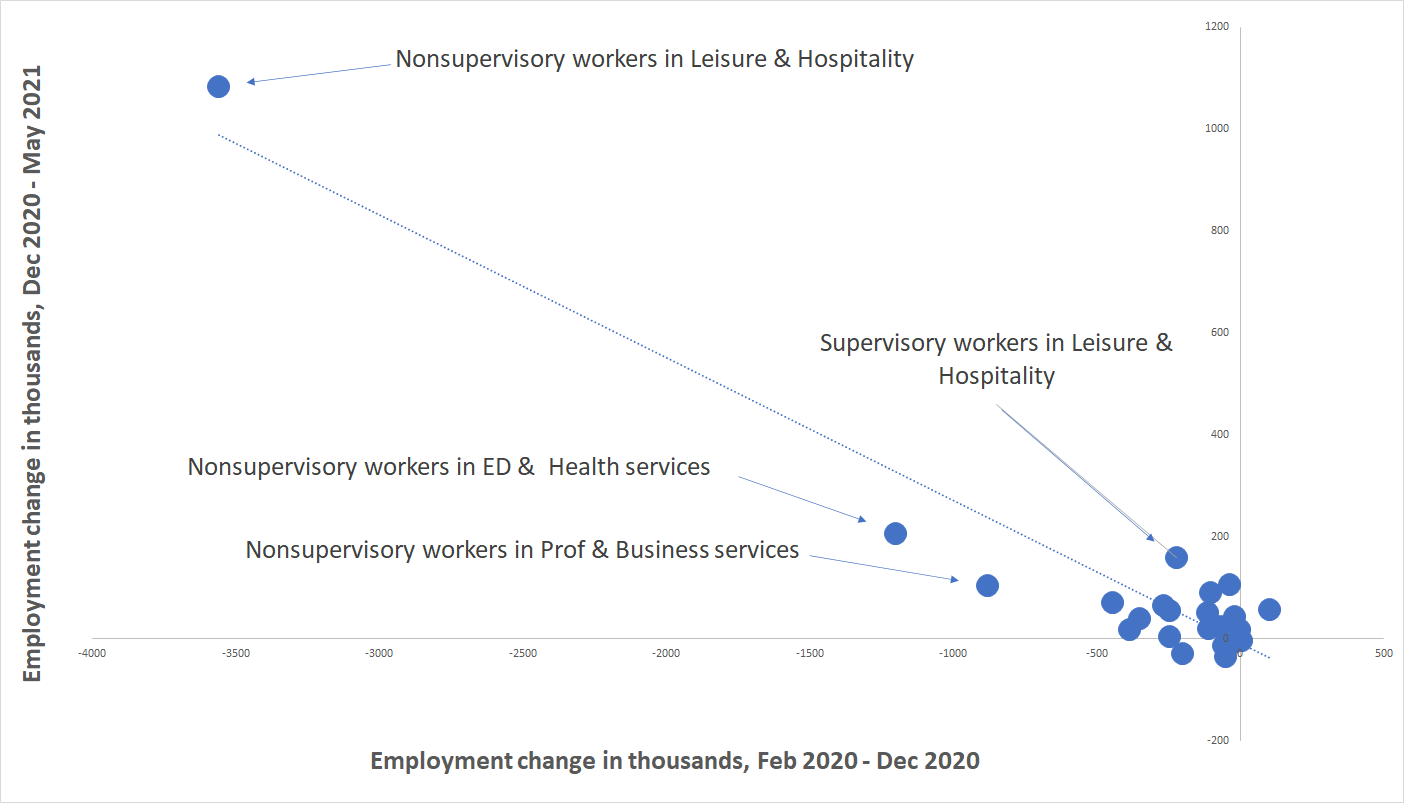
Figure C
Industry job growth in 2021 is well predicted by earlier COVID-19 losses


Note: The R-squared for the trend line is 0.91. There are 28 observations—one for production/nonsupervisory workers and one for nonproduction/supervisory workers in each of the 14 major private-sector industries. Employment for nonproduction/supervisory workers in an industry is simply the difference in employment between all workers in the industry and production/nonsupervisory workers in the industry.
Source: Authors’ analysis of data from the Current Employment Statistics (CES) program of the Bureau of Labor Statistics.
This chart appears in:
Previous chart: « Wage growth 15 months after COVID-19 shock is not that strong
Next chart: Productivity and median wage growth by race, 1979–2018 »