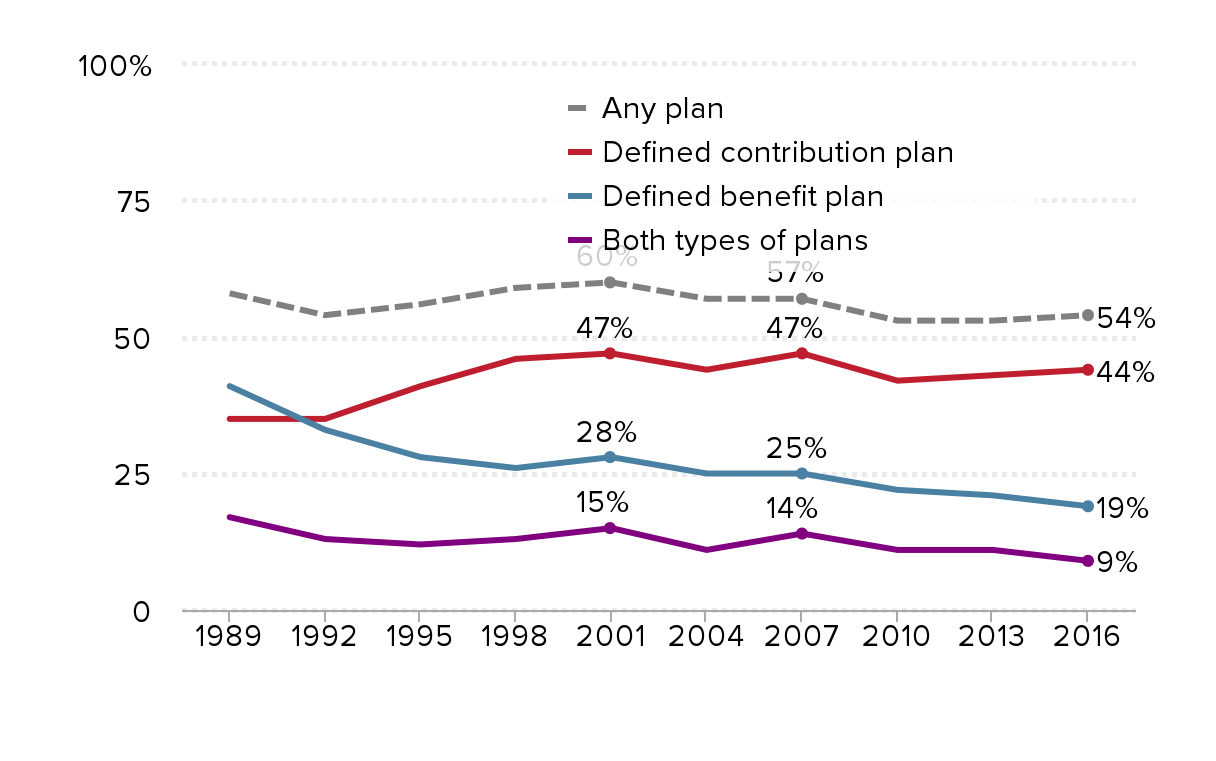
Figure 2
Retirement plan participation declined even as baby boomers approached retirement: Share of families age 32–61 participating in retirement plans by type, 1989–2016
| Defined benefit plan | Defined contribution plan | Both types of plans | Any plan | |
|---|---|---|---|---|
| 1989 | 41% | 35% | 17% | 58% |
| 1992 | 33% | 35% | 13% | 54% |
| 1995 | 28% | 41% | 12% | 56% |
| 1998 | 26% | 46% | 13% | 59% |
| 2001 | 28% | 47% | 15% | 60% |
| 2004 | 25% | 44% | 11% | 57% |
| 2007 | 25% | 47% | 14% | 57% |
| 2010 | 22% | 42% | 11% | 53% |
| 2013 | 21% | 43% | 11% | 53% |
| 2016 | 19% | 44% | 9% | 54% |

Note: Since DC and DB shares include families with both kinds of plans, the share with both types is subtracted from the total to produce the share with any plan. Shares indicate whether either the respondent or his or her spouse participated in such a plan or plans on a current job (individual participation rates are lower).
Source: EPI analysis of Survey of Consumer Finance data, 2016.
This chart appears in:
Previous chart: « The federal minimum wage would be much higher if it had kept up with a growing economy