Issue Brief #364
The never-ending fiscal and budget policy debates inside the Beltway have moved on to “tax reform.” Much of this tax reform concerns the corporate income tax, and the conventional wisdom in this debate is that the goal of reform should be revenue-neutral changes that broaden the base and lower the tax rate.
Given widespread concerns about federal budget deficits, it seems odd to call for tax changes that lower rates. The putative impetus for these calls is the belief that the statutory corporate income tax rate is too high—placing an excessive burden on U.S. corporations that leads to poor economic performance.
This brief examines corporate income-tax rates, and the argument linking low corporate tax rates with higher economic growth. The principal findings are:
- Claims that the United States’ corporate tax rate is uniquely burdensome to U.S. business when compared with the corporate tax rates of its industrial peers are incorrect. While the United States has one of the highest statutory corporate income-tax rates among advanced countries, the effective corporate income-tax rate (27.7 percent) is quite close to the average of rich countries (27.2 percent, weighted by GDP).
- The U.S. corporate income-tax rate is also not high by historic standards. The statutory corporate tax rate has gradually been reduced from over 50 percent in the 1950s to its current 35 percent.
- The current U.S. corporate tax rate does not appear to be impeding corporate profits. Both before-tax and after-tax corporate profits as a percentage of national income are at post–World War II highs; they were 13.6 percent and 11.4 percent, respectively, in 2012.
- Lowering the corporate income-tax rate would not spur economic growth. The analysis finds no evidence that high corporate tax rates have a negative impact on economic growth (i.e., it finds no evidence that changes in either the statutory corporate tax rate or the effective marginal tax rate on capital income are correlated with economic growth).
Why we need a corporate income tax
Corporate tax reform has been discussed with varying degrees of intensity since the advent of the corporate income tax in 1909. Over the past few years, there has been heated debate over the statutory corporate income-tax rate, which has stood at 35 percent since 1993. Many people point out that the statutory corporate tax rate is one of the highest in the industrialized world.1 Some, such as President Obama, advocate revenue-neutral corporate tax reform with a reduction in the statutory corporate tax rate and elimination or modification of corporate tax expenditures. Others argue for simple rate reduction (and corporate tax revenue reduction) or even outright elimination of the corporate income tax.
While the U.S. statutory corporate income-tax rate is generally higher than the tax rate in other advanced countries (those in the Organization for Economic Cooperation and Development), the effective tax rate is about the same as in other OECD countries (Gravelle 2012). For example, PricewaterhouseCoopers (2011) estimated that the U.S. effective corporate tax rate, averaged over 2006 to 2009, was 27.7 percent, while the average effective tax rate for 21 OECD countries was 23.5 percent.2 This OECD average, however, gives equal weight to the tax rates of all countries, large and small. If the tax rates are weighted by GDP, the average effective tax rate was 27.2 percent over the 2006–2009 period.
The corporate income tax serves three important functions. First, it raises a significant amount of revenue for the federal government—$242.3 billion in fiscal 2012, or almost 10 percent of total federal revenues. However, the corporate income tax is less important now than in the 1950s, when it accounted for about 30 percent of total revenues.
Second, the corporate income tax contributes to the overall progressivity of the tax system to the extent that the corporate tax burden falls on capital. While some recent research has estimated that most or all (in some cases over 100 percent) of the corporate tax burden falls on labor (e.g., Hassett and Mathur 2010), other evidence suggests that these findings are not robust to alternative specifications and do not address many of the theoretical issues associated with the burden of the corporate income tax (e.g., Gravelle and Hungerford 2008; Clausing 2011–2012; Clausing 2013). Many tax policy analysts and government agencies distribute the majority of corporate tax burden to capital (between 75 percent and 82 percent).3 Consequently, it is safe to say that the corporate income tax contributes to the progressivity of the overall tax system.
Third, the corporate income tax serves as a backstop to the individual income tax because it precludes using the corporation as a tax shelter for high-income taxpayers. Gravelle and Hungerford (2008, 422) note that if there were no corporate tax, “high-income individuals could channel funds into corporations and, with a large part of earnings retained, obtain lower tax rates than if they operated in partnership or proprietorship form.”
Corporate profitability
Corporate profitability is at an all-time high. Before-tax corporate profits (excluding the profits of the Federal Reserve banks) have averaged 10.5 percent of national income since the end of World War II (see Figure A).4 The trend in before-tax profits basically displays a U-shaped pattern over this 65-year period—falling from 13.4 percent in 1950, reaching a low of less than 7 percent in the early 1980s, and then increasing over the next three decades. In 2012, before-tax profits were equal to 13.6 percent of national income. Even in the depths of the Great Recession, corporate profits (9.6 percent of national income in 2008) were not far from their historical average.
The trend in after-tax corporate profits as a percentage of national income is also shown in Figure A. Between 1947 and 2012, the average value was 7.4 percent. In 2012, after-tax profits were equal to 11.4 percent of national income. Overall, the trend displays a U-shape that is much shallower than that of before-tax profits. But more importantly, after-tax profits since 2000 have generally been higher than after-tax profits in the 1950s. The gap between before-tax and after-tax corporate profits (as a percentage of national income) was 4 to 5 percentage points throughout the 1950s and most of the 1960s—reaching a high of 7 percentage points in 1951. The gap has narrowed considerably since the early 1980s and was at a low of 1.3 percentage points in 2009.
Corporate profits as a percentage of national income, 1947–2012
| Year | Before-tax | After-tax |
|---|---|---|
| 1947 | 10.8% | 5.9% |
| 1948 | 12.7% | 7.9% |
| 1949 | 12.0% | 8.0% |
| 1950 | 13.4% | 7.0% |
| 1951 | 13.3% | 6.3% |
| 1952 | 12.0% | 6.3% |
| 1953 | 11.4% | 5.8% |
| 1954 | 11.2% | 6.3% |
| 1955 | 13.1% | 7.5% |
| 1956 | 12.0% | 6.8% |
| 1957 | 11.4% | 6.6% |
| 1958 | 10.1% | 5.9% |
| 1959 | 11.7% | 6.9% |
| 1960 | 11.0% | 6.7% |
| 1961 | 10.9% | 6.6% |
| 1962 | 11.6% | 7.5% |
| 1963 | 12.0% | 7.8% |
| 1964 | 12.4% | 8.3% |
| 1965 | 13.1% | 8.8% |
| 1966 | 12.8% | 8.6% |
| 1967 | 11.8% | 8.0% |
| 1968 | 11.5% | 7.5% |
| 1969 | 10.3% | 6.6% |
| 1970 | 8.5% | 5.6% |
| 1971 | 9.2% | 6.2% |
| 1972 | 9.7% | 6.7% |
| 1973 | 9.6% | 6.5% |
| 1974 | 8.2% | 5.2% |
| 1975 | 8.8% | 6.2% |
| 1976 | 9.7% | 6.6% |
| 1977 | 10.3% | 7.2% |
| 1978 | 10.4% | 7.2% |
| 1979 | 9.6% | 6.7% |
| 1980 | 7.8% | 5.4% |
| 1981 | 7.7% | 5.8% |
| 1982 | 6.7% | 5.5% |
| 1983 | 8.0% | 6.5% |
| 1984 | 8.7% | 7.0% |
| 1985 | 8.6% | 7.0% |
| 1986 | 7.7% | 6.0% |
| 1987 | 8.5% | 6.4% |
| 1988 | 9.0% | 7.0% |
| 1989 | 8.4% | 6.4% |
| 1990 | 8.2% | 6.3% |
| 1991 | 8.4% | 6.7% |
| 1992 | 8.7% | 6.8% |
| 1993 | 9.1% | 7.0% |
| 1994 | 9.9% | 7.7% |
| 1995 | 10.6% | 8.2% |
| 1996 | 11.2% | 8.8% |
| 1997 | 11.6% | 9.2% |
| 1998 | 10.0% | 7.7% |
| 1999 | 9.9% | 7.7% |
| 2000 | 8.8% | 6.6% |
| 2001 | 8.2% | 6.7% |
| 2002 | 9.0% | 7.7% |
| 2003 | 9.7% | 7.9% |
| 2004 | 11.6% | 9.4% |
| 2005 | 12.7% | 9.8% |
| 2006 | 13.1% | 10.0% |
| 2007 | 11.9% | 9.2% |
| 2008 | 9.6% | 8.0% |
| 2009 | 10.7% | 9.4% |
| 2010 | 12.7% | 11.0% |
| 2011 | 13.1% | 11.4% |
| 2012 | 13.6% | 11.4% |

Source: Author's analysis of Bureau of Economic Analysis National Income and Product Accounts data
Corporate tax rates and economic growth
At first glance, a link between the statutory corporate tax rate and economic growth appears to go in the “wrong” direction—higher tax rates are consistent with higher economic growth rates! The economy grew at an annual average rate of 3.9 percent between 1950 and 1960, when the statutory corporate tax rate was over 50 percent. Between 2000 and 2010, the statutory corporate tax rate was 35 percent (over 15 percentage points lower than the rate in the 1950s), and annual economic growth averaged 1.8 percent (less than half of the growth rate in the 1950s).
The trend in real GDP growth is displayed in Figure B (dotted line). With its ups and downs since 1947, real GDP growth basically fluctuated around a downward trend. The statutory corporate tax rate is also displayed in Figure B (in dark blue). The tax rate leveled at about 52 to 53 percent through most of the 1950s and 1960s, then fell in steps to 35 percent. Again, this suggests a positive association between GDP growth and corporate tax rates.
Economic growth and corporate tax rates, 1947–2010
| Year | Real GDP growth | Effective rate on capital income | Statutory rate |
|---|---|---|---|
| 1947 | -0.9% | 38.0% | |
| 1948 | 4.3% | 38.0% | |
| 1949 | -0.5% | 38.0% | |
| 1950 | 8.4% | 42.0% | |
| 1951 | 7.5% | 50.8% | |
| 1952 | 3.8% | 52.0% | |
| 1953 | 4.5% | 52.0% | |
| 1954 | -0.6% | 58.0% | 52.0% |
| 1955 | 7.0% | 44.0% | 52.0% |
| 1956 | 2.0% | 46.0% | 52.0% |
| 1957 | 2.0% | 48.0% | 52.0% |
| 1958 | -0.9% | 47.0% | 52.0% |
| 1959 | 6.9% | 45.0% | 52.0% |
| 1960 | 2.4% | 42.0% | 52.0% |
| 1961 | 2.3% | 42.0% | 52.0% |
| 1962 | 5.9% | 35.0% | 52.0% |
| 1963 | 4.3% | 34.0% | 52.0% |
| 1964 | 5.6% | 31.0% | 50.0% |
| 1965 | 6.2% | 29.0% | 48.0% |
| 1966 | 6.3% | 30.0% | 52.8% |
| 1967 | 2.5% | 33.0% | 52.8% |
| 1968 | 4.7% | 37.0% | 52.8% |
| 1969 | 3.1% | 45.0% | 52.8% |
| 1970 | 0.2% | 42.0% | 49.2% |
| 1971 | 3.3% | 38.0% | 48.0% |
| 1972 | 5.2% | 38.0% | 48.0% |
| 1973 | 5.6% | 38.0% | 48.0% |
| 1974 | -0.6% | 42.0% | 48.0% |
| 1975 | -0.2% | 44.0% | 48.0% |
| 1976 | 5.2% | 40.0% | 48.0% |
| 1977 | 4.5% | 40.0% | 48.0% |
| 1978 | 5.4% | 46.0% | 48.0% |
| 1979 | 3.1% | 45.0% | 46.0% |
| 1980 | -0.3% | 48.0% | 46.0% |
| 1981 | 2.5% | 38.0% | 46.0% |
| 1982 | -2.0% | 35.0% | 46.0% |
| 1983 | 4.4% | 34.0% | 46.0% |
| 1984 | 6.9% | 33.0% | 46.0% |
| 1985 | 4.1% | 33.0% | 46.0% |
| 1986 | 3.4% | 33.0% | 46.0% |
| 1987 | 3.1% | 33.0% | 40.0% |
| 1988 | 4.0% | 33.0% | 34.0% |
| 1989 | 3.5% | 33.0% | 34.0% |
| 1990 | 1.9% | 31.0% | 34.0% |
| 1991 | -0.2% | 30.0% | 34.0% |
| 1992 | 3.3% | 30.0% | 34.0% |
| 1993 | 2.8% | 31.0% | 35.0% |
| 1994 | 4.0% | 30.0% | 35.0% |
| 1995 | 2.5% | 31.0% | 35.0% |
| 1996 | 3.7% | 31.0% | 35.0% |
| 1997 | 4.4% | 31.0% | 35.0% |
| 1998 | 4.3% | 30.0% | 35.0% |
| 1999 | 4.7% | 30.0% | 35.0% |
| 2000 | 4.1% | 31.0% | 35.0% |
| 2001 | 1.1% | 30.0% | 35.0% |
| 2002 | 1.8% | 29.0% | 35.0% |
| 2003 | 2.5% | 23.0% | 35.0% |
| 2004 | 3.4% | 26.0% | 35.0% |
| 2005 | 3.0% | 30.0% | 35.0% |
| 2006 | 2.6% | 35.0% | |
| 2007 | 1.9% | 35.0% | |
| 2008 | -0.3% | 35.0% | |
| 2009 | -3.5% | 35.0% | |
| 2010 | 3.0% | 35.0% |
Source: Author's analysis of Bureau of Economic Analysis National Income and Product Accounts data (Table 1.1.1), Internal Revenue Service Statistics of Income Historical Table 24, and Gravelle (2006)
The statutory corporate tax rate, however, does not necessarily capture the tax burden on new investment (Gravelle 1994). The effective marginal tax rate on earnings from investment could be a better measure of the tax burden.5 The trend in the effective marginal tax rate on capital income between 1953 and 2005 is also displayed in Figure B (in solid light blue).6 Except for a rather large dip followed by a large increase over the 1960s, the overall trend appears to have been downward between 1953 and 2005.
It is possible that the corporate tax rate affects economic growth with a lag. Consequently, real GDP growth is compared with the tax rates from the previous year. Figure C shows the scatter plot of real GDP growth and the 1-year lag of the statutory corporate tax rate between 1948 and 2010.7 The straight line is the trend line defined by the scatter plot.8 The slope of the trend line is upward, and the estimated correlation between the two series is +0.167, suggesting that higher tax rates are related to higher economic growth the next year. This estimated correlation, however, is not statistically significant.9 In other words, there is no apparent association between the statutory corporate tax rate and economic growth.
Relationship between statutory corporate tax rate and economic growth, 1948–2010
| Real GDP growth | Statutory corporate tax rate (1-year lag) | Trend line |
|---|---|---|
| -3.5 | 35.0 | 40.2 |
| -2.0 | 46.0 | |
| -0.9 | 52.0 | |
| -0.9 | 38.0 | |
| -0.6 | 52.0 | |
| -0.6 | 48.0 | |
| -0.5 | 38.0 | |
| -0.3 | 35.0 | |
| -0.3 | 46.0 | |
| -0.2 | 34.0 | |
| -0.2 | 48.0 | |
| 0.2 | 52.8 | |
| 1.1 | 35.0 | |
| 1.8 | 35.0 | |
| 1.9 | 34.0 | |
| 1.9 | 35.0 | |
| 2.0 | 52.0 | |
| 2.0 | 52.0 | |
| 2.3 | 52.0 | |
| 2.4 | 52.0 | |
| 2.5 | 35.0 | |
| 2.5 | 52.8 | |
| 2.5 | 46.0 | |
| 2.5 | 35.0 | |
| 2.6 | 35.0 | |
| 2.8 | 34.0 | |
| 3.0 | 35.0 | |
| 3.0 | 35.0 | |
| 3.1 | 52.8 | |
| 3.1 | 48.0 | |
| 3.1 | 46.0 | |
| 3.3 | 49.2 | |
| 3.3 | 34.0 | |
| 3.4 | 46.0 | |
| 3.4 | 35.0 | |
| 3.5 | 34.0 | |
| 3.7 | 35.0 | |
| 3.8 | 50.8 | |
| 4.0 | 35.0 | |
| 4.0 | 40.0 | |
| 4.1 | 46.0 | |
| 4.1 | 35.0 | |
| 4.3 | 35.0 | |
| 4.3 | 52.0 | |
| 4.3 | 38.0 | |
| 4.4 | 35.0 | |
| 4.4 | 46.0 | |
| 4.5 | 48.0 | |
| 4.5 | 52.0 | |
| 4.7 | 35.0 | |
| 4.7 | 52.8 | |
| 5.2 | 48.0 | |
| 5.2 | 48.0 | |
| 5.4 | 48.0 | |
| 5.6 | 52.0 | |
| 5.6 | 48.0 | |
| 5.9 | 52.0 | |
| 6.2 | 50.0 | |
| 6.3 | 48.0 | |
| 6.9 | 52.0 | |
| 6.9 | 46.0 | |
| 7.0 | 52.0 | |
| 7.5 | 42.0 | |
| 8.4 | 38.0 | 46.1 |
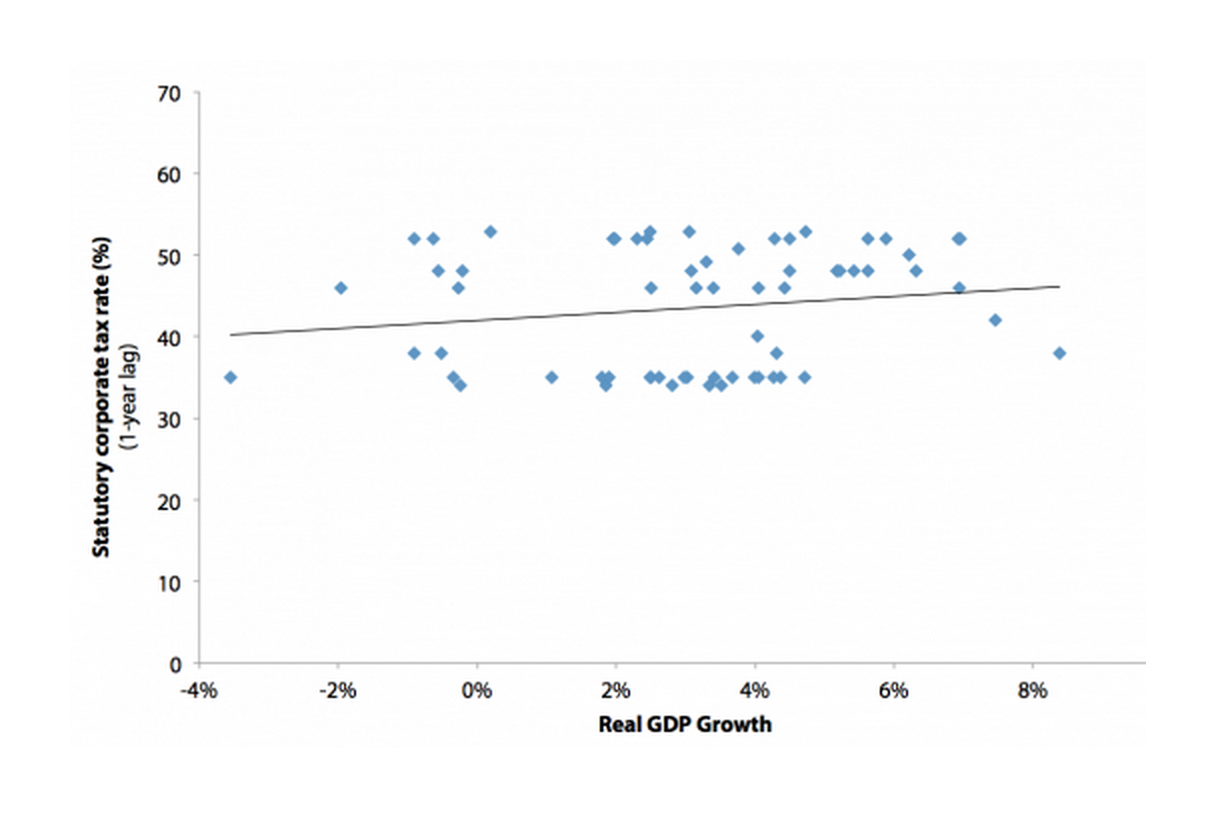
Note: Each dot shows the real GDP growth rate for a particular year and the statutory corporate tax rate from the previous year. The line describes the relation between the two variables.
Source: Author's analysis of Bureau of Economic Analysis National Income and Product Accounts data (Table 1.1.1) and Internal Revenue Service Historical Table 24
Figure D shows the scatter plot of real GDP growth and the 1-year lagged value of the effective marginal tax rate on capital income between 1954 and 2006. The trend line in this case is slightly downward sloping—the “right” direction according to those who argue that higher tax rates retard economic growth—and the estimated correlation is −0.064. This would suggest that a higher effective marginal tax rate is associated with slower economic growth. The estimated correlation, however, is not statistically significant.10 Again, there appears to be no relationship between capital income taxes and economic growth.
Relationship between effective marginal tax rate on capital income and economic growth, 1954–2006
| Real GDP growth | Effective marginal tax rate on capital income (1-year lag) | Trend line |
|---|---|---|
| -2.0% | 38.0% | 37.4% |
| -0.9% | 48.0% | |
| -0.6% | 38.0% | |
| -0.3% | 45.0% | |
| -0.2% | 31.0% | |
| -0.2% | 42.0% | |
| 0.2% | 45.0% | |
| 1.1% | 31.0% | |
| 1.8% | 30.0% | |
| 1.9% | 33.0% | |
| 2.0% | 44.0% | |
| 2.0% | 46.0% | |
| 2.3% | 42.0% | |
| 2.4% | 45.0% | |
| 2.5% | 30.0% | |
| 2.5% | 30.0% | |
| 2.5% | 48.0% | |
| 2.5% | 29.0% | |
| 2.6% | 30.0% | |
| 2.8% | 30.0% | |
| 3.0% | 26.0% | |
| 3.1% | 37.0% | |
| 3.1% | 46.0% | |
| 3.1% | 33.0% | |
| 3.3% | 42.0% | |
| 3.3% | 30.0% | |
| 3.4% | 33.0% | |
| 3.4% | 23.0% | |
| 3.5% | 33.0% | |
| 3.7% | 31.0% | |
| 4.0% | 31.0% | |
| 4.0% | 33.0% | |
| 4.1% | 33.0% | |
| 4.1% | 30.0% | |
| 4.3% | 31.0% | |
| 4.3% | 35.0% | |
| 4.4% | 31.0% | |
| 4.4% | 35.0% | |
| 4.5% | 40.0% | |
| 4.7% | 30.0% | |
| 4.7% | 33.0% | |
| 5.2% | 38.0% | |
| 5.2% | 44.0% | |
| 5.4% | 40.0% | |
| 5.6% | 34.0% | |
| 5.6% | 38.0% | |
| 5.9% | 42.0% | |
| 6.2% | 31.0% | |
| 6.3% | 29.0% | |
| 6.9% | 47.0% | |
| 6.9% | 34.0% | |
| 7.0% | 58.0% | 35.5% |
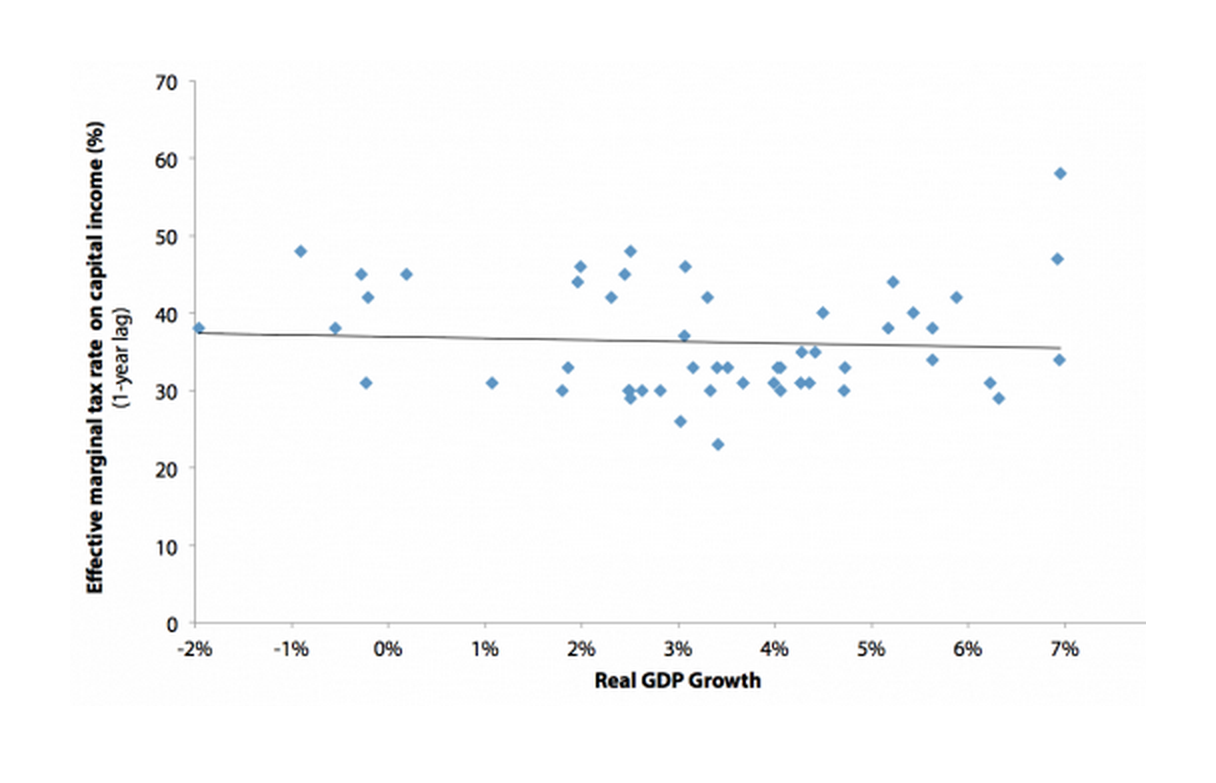
Note: Each dot shows the real GDP growth rate for a particular year and the effective marginal tax rate on capital income from the previous year. The line describes the relation between the two variables.
Source: Author's analysis of Bureau of Economic Analysis National Income and Product Accounts data (Table 1.1.1) and Gravelle (2006)
Conclusion
Corporate tax reform is a topic of discussion among policy analysts and policymakers. The proposed options range from broadening the tax base/lowering the rates to moving to a territorial system with low tax rates to outright elimination of the corporate income tax. Given that the corporate income tax serves several important functions, outright elimination of the tax is ill advised. The justification for lowering the corporate tax rate is that it will increase economic growth.
In 2012, corporate profits (before- and after-tax) as a share of national income were at a postwar high. Corporate profits were relatively high throughout the late 1940s and 1950s, and fell throughout the 1960s and 1970s to reach a low in 1982. Since then, corporate profits reversed course and have generally been rising to their current postwar high.
The top statutory corporate tax rate has been falling since the early 1950s. The top corporate tax rate was 52 percent throughout the Eisenhower administration—17 percentage points higher than the current top rate of 35 percent. U.S. GDP grew by almost 4 percent annually in the 1950s compared with a 1.8 percent growth rate in the 2000s. On the surface, it would appear that more robust economic growth is associated with higher corporate tax rates. Further analysis, however, finds no evidence that either the statutory top corporate tax rate or the effective marginal tax rate on capital income is correlated with real GDP growth.
About the author
Thomas L. Hungerford joined the Economic Policy Institute in 2013. Prior to joining EPI, Hungerford worked at the General Accounting Office, the Office of Management and Budget, the Social Security Administration, and the Congressional Research Service. He has published research articles in journals such as the Review of Economics and Statistics, Journal of International Economics, Journal of Human Resources, Journal of Urban Economics, Review of Income and Wealth, Journal of Policy Analysis and Management, Challenge, and Tax Notes. He has taught economics at Wayne State University, American University, and Johns Hopkins University. He has a Ph.D. in economics from the University of Michigan.
Appendix: Methodology
Multivariate time-series regression techniques were used to determine the statistical significance of the estimated relationship between corporate tax rates and real GDP growth. Data from 1947–2010 are used for the regression analysis. The standard errors were corrected allowing for heteroskedastic and autocorrelated error-term using the Newey-West procedure with five lags. All variables were tested for the presence of a unit root. Most variables were found to have a unit root and these variables were first differenced for the analysis (i.e., the one-year change in the variable is used in the analysis); none of the variables appears to be cointegrated. The specifications and the other explanatory variables included in the analysis (which are thought to affect the dependent variables) have been used by other researchers in empirical research (see Lee and Gordon 2005). The tax rate variables are entered into the regression as the change in the after-tax or net-of-tax shares, which are equal to 1 minus the tax rate (i.e., ∆(1-TR)). In addition to the tax rate variables, right-hand side variables include the population growth rate, the change in the proportion of the population with at least a four-year college degree, and the change in federal current expenditures as a percentage of potential GDP (Lee and Gordon 2005). The regression results are reported in Table A1 (for the statutory corporate tax rate) and Table A2 (for the effective marginal tax rate on capital income).
Regression of real GDP growth on the statutory corporate tax rate (standard errors in parentheses)
| Lag on ∆(1-TR) | (1) | (2) | (3) | (4) |
|---|---|---|---|---|
| 1-year | -0.0809 | 0.1835 | ||
| (0.1827) | (0.1530) | |||
| 2-year | 0.0611 | |||
| (0.1388) | ||||
| 3-year | -0.0562 | |||
| (0.292) | ||||
| 4-year | -0.1047 | |||
| (0.1857) | ||||
| 5-year | -0.0049 | 0.1113 | ||
| (0.0931) | (0.1722) | |||
| 6-year | -0.0878 | |||
| (0.1661) | ||||
| 7-year | 0.244 | |||
| (0.2709) | ||||
| 8-year | 0.0094 | |||
| (0.3148) | ||||
| 9-year | -0.0193 | |||
| (0.1327) | ||||
| 10-year | -0.0529 | -0.0552 | ||
| (0.1542) | (0.1915) | |||
| F-Stat (joint) | 1.32 | |||
| # observations | 61 | 60 | 55 | 55 |
Source: Author's analysis of Bureau of Economic Analysis National Income and Product Accounts data (Table 1.1.1) and Internal Revenue Service Historical Table 24
Regression of real GDP growth on the effective marginal tax rate on capital income (standard errors in parentheses)
| Lag on ∆(1-TR) | (1) | (2) | (3) | (4) |
|---|---|---|---|---|
| 1-year | -0.0215 | 0.026 | ||
| (0.0862) | (0.1294) | |||
| 2-year | 0.1134 | |||
| (0.1031) | ||||
| 3-year | 0.0375 | |||
| (0.0994) | ||||
| 4-year | 0.0196 | |||
| (0.1738) | ||||
| 5-year | 0.086 | 0.0489 | ||
| (0.0848) | (0.1194) | |||
| 6-year | 0.0539 | |||
| (0.1524) | ||||
| 7-year | 0.0797 | |||
| (0.0953) | ||||
| 8-year | 0.0998 | |||
| (0.1105) | ||||
| 9-year | -0.0939 | |||
| (0.1107) | ||||
| 10-year | -0.1124 | -0.1087 | ||
| (0.0773) | (0.0942) | |||
| F-Stat (joint) | 4.54*** | |||
| # observations | 51 | 51 | 46 | 42 |
*** Significant at the 1 percent level
Source: Author's analysis of Bureau of Economic Analysis National Income and Product Accounts data (Table 1.1.1) and Gravelle (2006)
Four specifications are estimated based on how the tax rate variable is entered. In the first specification in the two appendix tables, the tax rate variable is the 1-year lagged value of the change in the net-of-tax rate. In the second and third specifications the 5-year and 10-year lagged value is entered, respectively. Lastly, the 10-year distributed lag of the tax rate variable is entered. In the distributed lag model, an additional hypothesis test is performed. An F-test on whether or not all the tax rate variables in the distributed lag are jointly significant is performed.
Endnotes
1. For a recent example, see Graham Bowley, “The Corporate Tax Games,” New York Times, May 3, 2013, p. B1. Gravelle (2012), however, shows that the effective U.S. corporate tax rate is not much different from the OECD average (weighted by GDP).
2. The 21 countries are Australia, Austria, Belgium, Canada, Denmark, Finland, France, Germany, Ireland, Israel, Italy, Japan, Korea, Luxembourg, Netherlands, Norway, Portugal, Spain, Sweden, Switzerland, and United Kingdom.
3. The Congressional Budget Office (CBO) distributes 25 percent of the tax burden to labor (CBO 2012), the Department of Treasury distributes 18 percent to labor (Cronin et al. 2012), and the Tax Policy Center distributes 20 percent to labor (Nunns 2012).
4. Corporate profits are income earned from production of all U.S. corporations (C corporations, S corporations, and private corporations) including income earned abroad (Hodge 2011).
5. Neubig (2012) argues that many corporations may be more concerned with the statutory corporate tax rate rather than the effective tax rate, which includes the effects of all features of the tax code.
6. The effective marginal tax rates come from Gravelle (2006), Table 1. The effective marginal tax rate is a weighted economy-wide average of corporations, unincorporated businesses, and owner-occupied housing.
7. Each dot in the figure shows the real GDP growth rate for a particular year and the statutory corporate tax rate from the previous year. For example, the dot at the left side of the figure shows GDP growth in 2009 and the 2008 statutory corporate tax rate.
8. The trend line is the straight line that best fits or describes the relation between two variables.
9. The hypothesis that there is no relation between the two variables cannot be rejected. Additionally, multivariate regression analysis shows that the estimated association between real GDP growth and the 1-year lag of the corporate tax rate is small and not statistically significant. In addition, specifications using a 5-year lag, a 10-year lag, and a 10-year distributed lag yield similar results with coefficient estimates that are not statistically significant. The regression results are reported in the appendix. See Hungerford (2012) for a description of this kind of analysis.
10. The estimated relationship between these two variables in a multivariate regression analysis is also small and not statistically significant. Furthermore, specifications using a 5-year lag, a 10-year lag, and a 10-year distributed lag yield similar results. The regression results are reported in the appendix tables.
References
Bureau of Economic Analysis (U.S. Department of Commerce). Various years. National Income and Product Accounts Tables [data tables]. http://bea.gov/iTable/iTable.cfm?ReqID=9&step=1
Clausing, Kimberly A. 2011–2012. “In Search of Corporate Tax Incidence,” Tax Law Review, vol. 65, 433–472.
Clausing, Kimberly. 2013. “Who Pays the Corporate Tax in a Global Economy?” National Tax Journal, vol. 66, no. 1, 151–184.
Congressional Budget Office. 2012. The Distribution of Household Income and Federal Taxes, 2008 and 2009.
Cronin, Julie-Anne, Emily Y. Lin, Laura Power, and Michael Cooper. 2012. “Distributing the Corporate Income Tax: Revised U.S. Treasury Methodology.” National Tax Journal, vol. 66, no. 1, 239–262.
Gravelle, Jane G. 1994. The Economic Effects of Taxing Capital Income. Cambridge, Mass.: MIT Press.
Gravelle, Jane G. 2006. Historical Effective Marginal Tax Rates on Capital Income. Congressional Research Service report RS21706.
Gravelle, Jane G. 2012. International Corporate Tax Rate Comparisons and Policy Implications. Congressional Research Service report R41743.
Gravelle, Jane G., and Thomas L. Hungerford. 2008. “Corporate Tax Reform: Should We Really Believe the Research?” Tax Notes, vol. 121, no. 4, 419–438.
Hassett, Kevin A., and Aparna Mathur. 2010. Spatial Tax Competition and Domestic Wages. American Enterprise Institute working paper. http://www.aei.org/paper/100185.
Hodge, Andrew W. 2011. “Comparing NIPA Profits with S&P 500 Profits.” Survey of Current Business. March, 22–27.
Hungerford, Thomas L. 2012. Taxes and the Economy: An Economic Analysis of the Top Tax Rates Since 1945. Congressional Research Service report R42729. http://graphics8.nytimes.com/news/business/0915taxesandeconomy.pdf.
Internal Revenue Service. Various years. SOI Tax Stats. “Historical Table 24: U.S. Corporation Income Tax: Tax Brackets and Rates, 1909–2010.” http://www.irs.gov/uac/SOI-Tax-Stats—Historical-Table-24
Lee, Young, and Roger H. Gordon. 2005. “Tax Structure and Economic Growth.” Journal of Public Economics, vol. 89, 1027–1083.
Neubig, Thomas S. 2012. “Interaction of Tax and Financial Accounting on Tax Reform.” Testimony before the House Committee on Ways and Means, February 8.
Nunns, Jim. 2012. How TPC Distributes the Corporate Income Tax. Urban-Brookings Tax Policy Center.
PricewaterhouseCoopers. 2011. Global Effective Tax Rates. http://businessroundtable.org/uploads/studies-reports/downloads/Effective_Tax_Rate_Study.pdf.