Issue Brief #351
As is well-documented in The State of Working America, 12th Edition (Mishel et al. 2012), the U.S. economy has worked primarily to the advantage of a small sliver of winners. Meanwhile, the vast majority of workers have not fared well—a trend that stretches back to the 1970s.
Between 1973 and 2011, the median worker’s real hourly compensation (which includes wages and benefits) rose just 10.7 percent. Most of this growth occurred in the late 1990s wage boom, and once the boom subsided by 2002 and 2003, real wages and compensation stagnated for most workers—college graduates and high school graduates alike. This has made the last decade a “lost decade” for wage growth. The last decade has also been characterized by increased wage inequality between workers at the top and those at the middle and bottom, and by the continued divergence between overall productivity and the wages or compensation of the typical worker. This divergence has been demonstrated anew in the current recovery over 2009–2011 as real wages fell for the bottom ninety percent of the wage distribution but rose for the top five percent (Mishel and Finio 2013).
Contrary to some political rhetoric of late, wage stagnation for American workers and rising inequality is not due to lack of effort; the broad middle class has increased its productivity, upgraded its educational attainment, and worked more hours (Mishel 2013). Rather it is due to certain policies that have weakened the bargaining position of low- and middle-wage workers. Among these policies is the refusal to set the minimum wage at a level where it establishes a well-enforced wage floor at 50 percent of the average wage. This paper reviews the history of the minimum wage over the last 50 years and the role of a lowered value of the minimum wage in rising wage inequality.
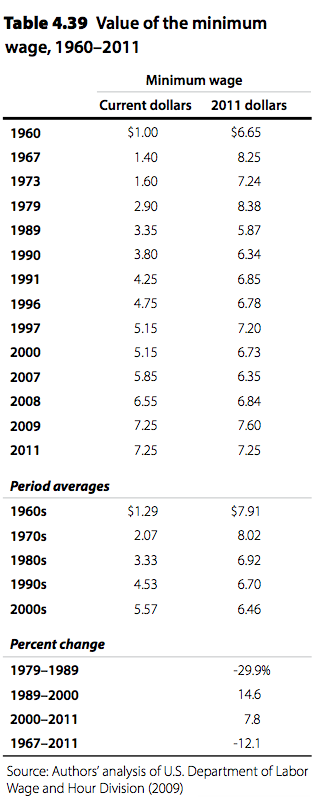
- Legislated increases in the federal minimum wage in both 2007 and 2008 boosted it from $5.15 in 2006 to $7.25 in 2009, its highest level in real terms since 1981. But even after this nearly 41 percent increase, the minimum wage in 2009 was still 7.8 percent less than its value in 1967 (in 2011 dollars).
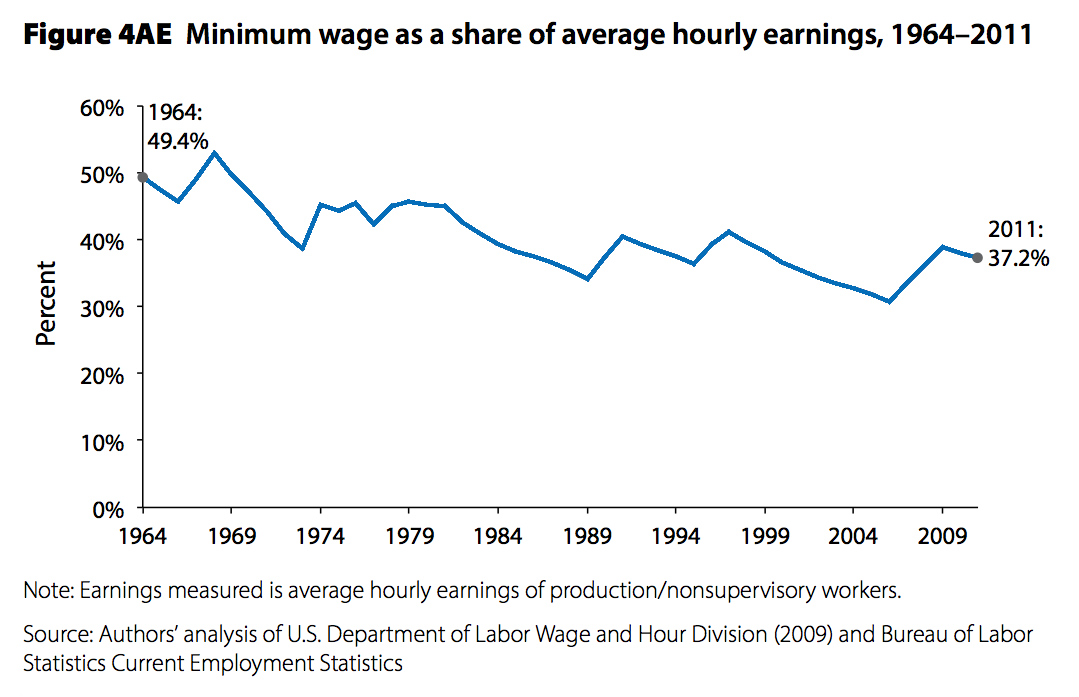
- In 2011, the minimum wage was worth only about 37 percent of what an average worker earned per hour, not far above its lowest point, reached in 2006, in 47 years.
- A higher minimum wage would disproportionately affect women: They constitute a majority (54.5 percent) of those who would benefit, greater than their 48.3 percent share of the workforce. Historically, the minimum wage has been more important in setting a floor for women than for men.
- The vast majority (87.9 percent) of those who would be affected by the higher minimum wage are age 20 or older.
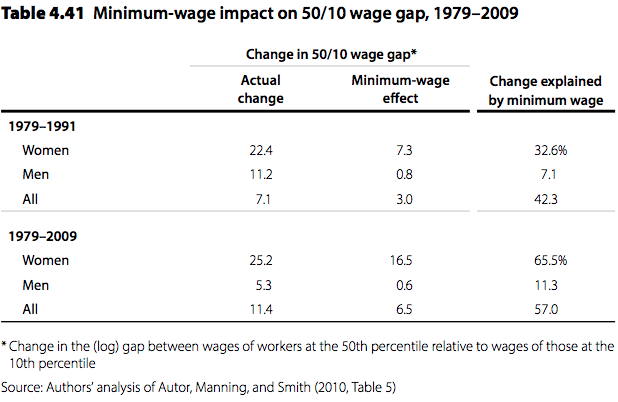
- A higher minimum wage would help address growing inequality, particularly as it affects lower-wage women. Between 1979 and 2009 the erosion of the minimum wage explained about two-thirds (65.5 percent) of the large 25.2 (log percentage point) expansion of the wage gap between median-wage workers and workers at the 10th percentile in wages—known as the 50/10 wage gap—among women but just over a tenth (11.3 percent) of the smaller 5.3 expansion of the 50/10 wage gap among men. For workers overall more than half (57.0 percent) of the increase in the 50/10 wage gap from 1979 to 2009 was accounted for by the erosion of the minimum wage.
The following discussion replicates the text, tables, and figures from the minimum wage discussion in Chapter 4 of EPI’s The State of Working America, 12th Edition. The tables can also be found online at stateofworkingamerica.org.
The decline in the real value of the minimum wage
Table 4.39 and Figure 4AD track changes in the value of the minimum wage. Legislated increases in the federal minimum wage in both 2007 and 2008 boosted it from $5.15 in 2006 to $7.25 in 2009, its highest level in real terms since 1981. But even after this nearly 41 percent increase, the minimum wage in 2009 was still 7.8 percent less than its value in 1967 (in 2011 dollars). After two years of inflation the minimum wage in 2011 was 12.1 percent below the 1967 level. The minimum wage declined steeply and steadily between 1979 and 1989, when inflation whittled it down from $8.38 to $5.87 (in 2011 dollars), a fall of 29.9 percent. The legislated increases in the minimum wage in 1990 and 1991 and again in 1996 and 1997 raised the value of the minimum wage from 1989 to 2000 by 14.6 percent (in 2011 dollars). The value grew another 7.8 percent from 2000 to 2011.

A more appropriate way to assess the level of the current minimum wage in historical terms is to examine the minimum wage’s share of the average worker’s wage (as measured by the average hourly earnings of production/nonsupervisory workers), as shown in Figure 4AE. In 2011, the minimum wage was worth only about 37 percent of what an average worker earned per hour, not far above its lowest point, reached in 2006, in 47 years. In contrast, the minimum wage’s share of the average wage was about 50 percent in the late 1960s, about 45 percent in the mid-1970s, and about 40 percent in the early 1990s. This analysis shows that the earnings of low-wage workers have fallen significantly behind those of other workers, and that the decline in the real value of the minimum wage is a causal factor in rising wage inequality.
It has been argued that the minimum wage primarily affects teenagers and others with no family responsibilities. To address this claim, Table 4.40 examines the demographic composition of the workforce that would benefit from an increase in the minimum wage in 2014 to $9.80, about 47 percent of the average wage. This analysis takes into account the many workers benefiting from a state minimum wage higher than the current federal level (discussed further below). Assessing who would benefit sheds light on who has been affected by the long-term drop in the real value of the minimum wage.
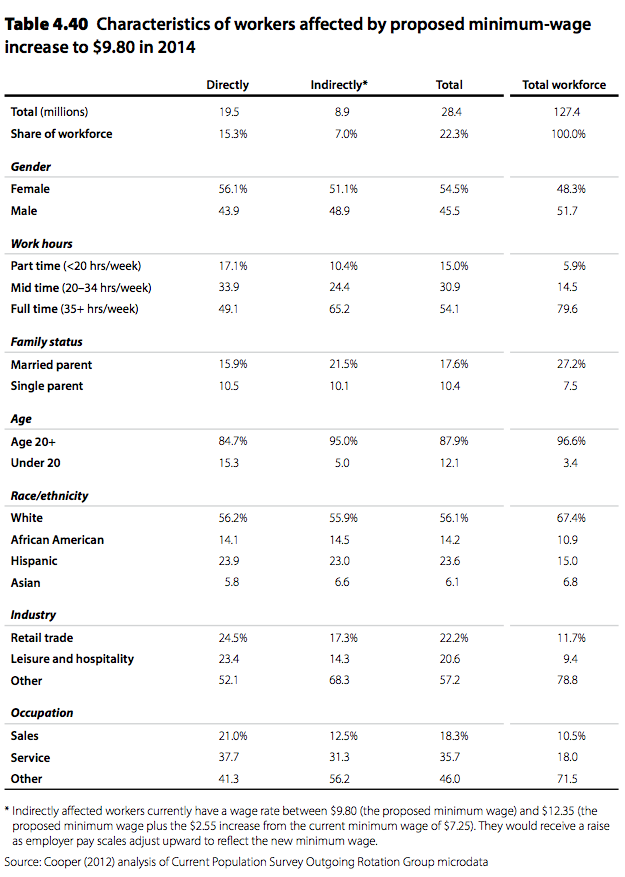
An analysis of only those earning between the current and the proposed new minimum wage would be too narrow, since a higher minimum wage would affect workers who earn more than but close to the proposed new minimum; they would receive increases if the minimum wage rises. For these reasons, Table 4.40 also includes other low-wage workers who would gain from the “spillover effect” of a higher minimum wage. The table presents information on these workers in the column labeled “Indirectly,” a group totaling 8.9 million workers, or 7.0 percent of the workforce. The increase would affect 19.5 million workers directly, or 15.3 percent of the workforce. In total, the change in the minimum wage to $9.80 would affect a substantial group, 28.4 million workers, or 22.3 percent of the workforce. By this metric over a fifth of the workforce has been affected by the eroded value of the minimum wage.
A higher minimum wage would disproportionately affect women: They constitute a majority (54.5 percent) of those who would benefit, greater than their 48.3 percent share of the workforce. The vast majority (87.9 percent) of those who would be affected by the higher minimum wage are age 20 or over; thus, it is clear the increase would not mainly benefit teenagers. Similarly, single parents would disproportionately benefit from a higher minimum wage: 10.4 percent of those who would be affected are single parents, higher than their 7.5 percent share of the workforce. In addition, many beneficiaries (17.6 percent of the total) of the proposed minimum-wage increase are parents in a married-couple family; this share is less than their 27.2 percent share of the workforce. While minorities are disproportionately represented among the potential beneficiaries (23.6 and 14.2 percent are, respectively, Hispanic and African American), the majority, 56.1 percent, are white. A majority (54.1 percent) also work full time (at least 35 hours weekly), and another 30.9 percent work at least 20 hours but less than 35 hours each week.
Table 4.40 also shows that the beneficiaries of a potential minimum-wage increase are disproportionately concentrated in the retail and hospitality industries (42.8 percent are employed there, compared with just 21.1 percent of all workers), while other industries are underrepresented among this group. The demographic breakdown of those affected by the spillover effects of the proposed increase—those indirectly affected—is more inclusive of full-time and adult workers but has a similar racial/ethnic breakdown as the group directly affected.
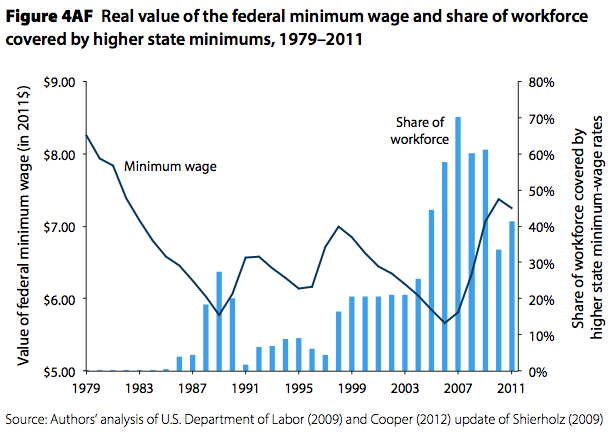
The impact of the recent and proposed increases in the federal minimum wage is diminished somewhat compared with that of earlier increases because a substantial number of states have raised their own minimum-wage levels in recent years, reducing the number of workers affected by any proposed federal change. Figure 4AF contrasts the real value of the federal minimum wage with the share of the workforce covered by legislated state minimum wages that exceed the federal level. In 2007 31 states that were home to 70 percent of the nation’s workforce had a minimum wage exceeding the federal level. By 2011 the number had declined to 17 states and about 41 percent of the workforce.
Another way to assess the importance of the minimum wage is to measure the share of total hours worked by workers earning at or below (some workers are not covered by minimum-wage laws) the legislated minimum (both federal and state). Figure 4AG illustrates that the minimum wage has been more important in setting a floor for women than for men and that there was a substantial erosion of the importance of the minimum wage for women in the 1980s. Since then the share of hours worked at or below the minimum wage has remained fairly low, except for a slight trend upward in the mid-2000s. It is notable that the 50/10 wage gap among women grew tremendously (as the 10th-percentile wage fell) in the 1980s, at the same time as the share of total hours worked by women workers earning at or below the legislated minimum fell.
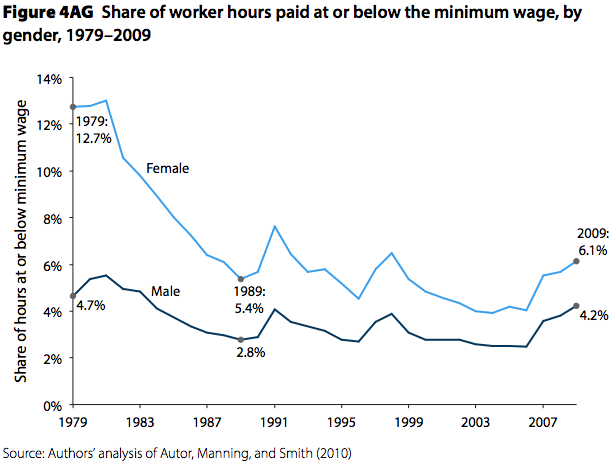
Table 4.41 shows the impact of the minimum wage (including spillover impacts affecting workers just above the minimum) on the 50/10 wage gap among women, men, and overall in the years 1979–1991, when the value of the minimum wage eroded significantly, and over the longer period from 1979 to 2009. The results in Table 4.41 confirm that the deterioration in the minimum wage’s value had a much larger impact on wages of women than of men. Between 1979 and 2009 the erosion of the minimum wage explained about two-thirds (65.5 percent) of the large 25.2 (log percentage point) expansion of the 50/10 wage gap among women but just over a tenth (11.3 percent) of the smaller 5.3 expansion of the 50/10 wage gap among men. For workers overall more than half (57.0 percent) of the increase in the 50/10 wage gap from 1979 to 2009 was accounted for by the erosion of the minimum wage. Curiously, the impact of the minimum wage on the 50/10 wage gap was less from 1979 to 1991 than from 1979 to 2009 even though the major decline of the value of the minimum wage occurred in the 1980s. Still, about a third of the 50/10 wage gap expansion among women from 1979 to 1991 can be explained by the falling value of the minimum wage.
The level of the minimum wage strongly affects the wage gains of low-wage workers, particularly low-wage women whose wages over the last few decades have essentially been set by the legislated minimum. Thus, the erosion of the minimum wage’s value (along with high unemployment) led to a precipitous drop in the wages of low-wage women in the 1980s and to a large increase in the 50/10 wage gap. Wages among low-wage women (i.e., at the 10th percentile) stabilized in the late 1980s after these wages had descended close to their lowest possible level (i.e., near the minimum wage, where employers could still possibly hire) and as unemployment dropped. Thereafter, the 50/10 gap was flat or declined as unemployment fell to low levels in the late 1990s and as the federal government implemented two sets of increases in the minimum wage in the 1990s. Between 1999 and 2006, as the real value of the minimum wage eroded and unemployment rose, wage growth of low-wage women once again weakened, and the 50/10 wage gap grew. The legislated increases in the federal minimum wage that took effect in 2007, 2008, and 2009 kept the 50/10 wage gap among women from rising despite higher unemployment.
Conclusion
The last decade has produced no improvement in real wages of a broad range of workers, including those with either a high school or college degree. It has also produced a widening divergence between overall productivity and the wages or compensation of the typical worker. In addition, wage inequality has continued to grow between those at the top and the rest.
The declining value of the minimum wage has played a key role in these trends. Setting the minimum wage at an appropriate level can help spur broad-based wage growth and move us toward an economy where workers benefit from productivity growth. Such policies are needed to reverse those policies that have strengthened the hands of employers and undercut the ability of low- and middle-wage workers to have good jobs and economic security.
If we want the fruits of economic growth to benefit the vast majority, we will have to adopt a different set of guideposts for setting economic policy, as the ones in place over the last several decades have served those with the most income, wealth, and political power. Establishing a higher minimum wage is an important piece of what is needed.
—Lawrence Mishel has been president of the Economic Policy Institute since 2002. Prior to that he was EPI’s first research director (starting in 1987) and later became vice president. He is the co-author of all 12 editions of The State of Working America. He has a Ph.D. in economics from the University of Wisconsin-Madison, and his articles have appeared in a variety of academic and non-academic journals. His areas of research are labor economics, wage and income distribution, industrial relations, productivity growth, and the economics of education.
References
Autor, David, Alan Manning, and Christopher Smith. 2010. The Contribution of the Minimum Wage to U.S. Wage Inequality Over Three Decades: A Reassessment. Massachusetts Institute of Technology Working Paper. http://economics.mit.edu/files/3279\
Bureau of Labor Statistics (U.S. Department of Labor) Current Employment Statistics program. Various years. Employment, Hours and Earnings—National [database]. http://www.bls.gov/ces/#data
Cooper, David. 2012. “A Rising Tide for Increasing Minimum Wage Rates.” Working Economics (Economic Policy Institute blog), April 13. http://www.epi.org/blog/proposals-increasing-minimum-wage/
Current Population Survey Outgoing Rotation Group microdata. Various years. Survey conducted by the Bureau of the Census for the Bureau of Labor Statistics [machine-readable microdata file]. Washington, D.C.: U.S. Census Bureau. http://www.bls.census.gov/ftp/cps_ftp.html#cpsbasic
Mishel, Lawrence. 2013. Vast Majority of Wage Earners are Working Harder, and for Not Much More: Trends in U.S. Work Hours and Wages over 1979–2007. Economic Policy Institute Issue Brief No. 348. http://www.epi.org/publication/ib348-trends-us-work-hours-wages-1979-2007/
Mishel, Lawrence, Josh Bivens, Elise Gould, and Heidi Shierholz. 2012. The State of Working America, 12th Edition. An Economic Policy Institute book. Ithaca, N.Y.: Cornell University Press.
Mishel, Lawrence, and Nicholas Finio. 2013. Earnings of the Top 1.0 Percent Rebound Strongly in the Recovery. Economic Policy Institute Issue Brief No. 347. http://www.epi.org/publication/ib347-earnings-top-one-percent-rebound-strongly/
Shierholz, Heidi. 2009. Fix It and Forget It: Index the Minimum Wage to Growth in Average Wages. Economic Policy Institute Briefing Paper No. 251. http://www.epi.org/page/-/pdf/bp251.pdf
U.S. Department of Labor, Wage and Hour Division. 2009. “Federal Minimum Wage Rates Under the Fair Labor Standards Act.” http://www.dol.gov/whd/minwage/chart.pdf
This issue brief replicates the text, tables, and figures from the minimum wage discussion in Chapter 4 of EPI’s The State of Working America, 12th Edition, with a supplemental introduction and conclusion. Chapters from the book and other resources can be accessed at stateofworkingamerica.org.